Personal Wealth Management / Market Analysis
Commentary on the WTI – Brent Differential
An unprecedented phenomenon is currently afoot in the Energy sector—the price differential between West Texas Intermediate (WTI) and Brent crude oil hit an all-time discount. Here's a look at what's driving this gap.

An unprecedented phenomenon is currently afoot in the Energy sector—the price differential between West Texas Intermediate (WTI) and Brent crude oil hit an all-time discount recently of $19 per barrel. Normally, WTI trades at a small premium of $1 to $3 per barrel. While the discount is a recent occurrence, the drivers behind the divergence began several years ago—and have important implications for investors.
Exhibit 1: WTI-Brent Differential
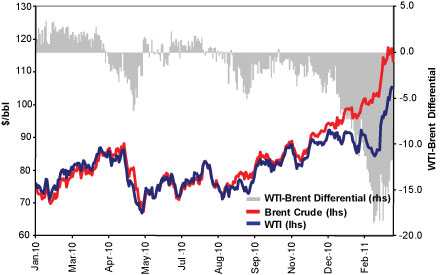
Source: Thomson Reuters; West Texas Intermediate Spot Cushing and Brent Current Month FOB; data are from January 1, 2010 through March 8, 2011.
First, a little history. WTI became relevant in 1983 with the introduction of the first successful futures contract on the New York Mercantile Exchange (NYMEX). Open interest grew rapidly in the 1980s and 1990s and even more so in last decade, propelling WTI into the oil industry lexicon. Through the futures market, WTI became a favored instrument for investors to gain exposure to the price of crude oil.
But crude oil is largely fungible—that is, the price of the commodity is largely independent of its location, and any price difference should be primarily attributable to the quality of the crude. Brent crude, sourced from the North Sea and traded in London, has historically been seen as a lower quality than WTI, which is sweeter (lower sulfur content) and lighter and thus easier to refine into petroleum products like gasoline and diesel fuel. Hence, WTI has historically traded at a premium to Brent crude.
However, toward the latter half of the 2000s, North Sea production began a steady decline, effectively tightening the Brent crude market. At the same time, the reverse situation was developing in North America, with a surge in unconventional oil production setting in motion the drivers behind the price differential today.
A Surge in Unconventional Production
Unconventional resourcesare typically non-traditional sources of crude oil and natural gas. Two key sources are shale oil and bitumen. Shale oil is trapped in formations of sedimentary rock with low porosity and permeability. Bitumen is a form of sticky, tar-like, heavy oil that is particularly challenging to refine. Only recently did producers develop the technology to cost-effectively access and refine these unconventional resources.
Both of these resources are found in Western Canada, where production has exploded—from 2.2 Mb/d in 2005 to 2.9 Mb/d in 2010. Production is expected to climb over 3 Mb/d in the next few years. At the same time, producers have utilized new technologies like hydraulic fracturing (“fracking”) and horizontal drilling to access shale formations just across the US-Canadian border in North Dakota and Montana. Production from the Bakken Shale, an oil-rich shale formation in North Dakota, has correspondingly surged, rising from 99 kb/d at the start of 2006 to 342 kb/d as of September 2010—representing more than 6% of current total US crude oil production. Exhibit 2 shows crude production in the PADD 2 district, the Petroleum Administration’s designation for the Midwest region. Led by the Bakken Shale, North Dakota now accounts for nearly half the region’s crude production.
Exhibit 2: PADD 2 (Midwest) Crude Production
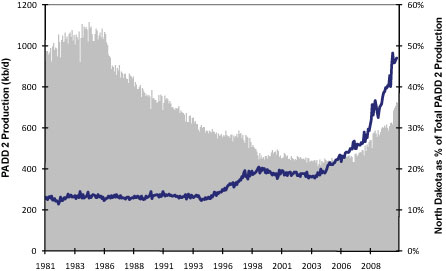
Source: US Department of Energy; Midwest (PADD 2) Field Production of Crude Oil (Thousand Barrels); data are from January 1981 through September 2010.
Transportation & Storage Capacity
All this production needs to reach refineries and other end consumers via pipeline networks. With only Kinder Morgan’s TransMountain pipeline (300 kb/d) able to take oil from inland Canada to the western coast, the vast majority of the region’s production is landlocked and thus forced via pipeline south into PADD 2. Within the last year, two major pipelines have added a combined 1Mb/d of capacity from Alberta, meaning the flow into Cushing, Oklahoma—the delivery point for WTI/NYMEX crude oil futures contracts—continues to increase. Rising Bakken production only exacerbates the supply problem. There is simply more oil flowing into PADD 2 than the refinery system in the region can handle.As Exhibit 3 shows, current crude stocks at Cushing are pushing up against total effective storage capacity. With this, storage is getting increasingly more expensive and difficult to source, forcing producers to sell into the cheaper spot market.
Exhibit 3: Crude Oil Storage at Cushing, OK
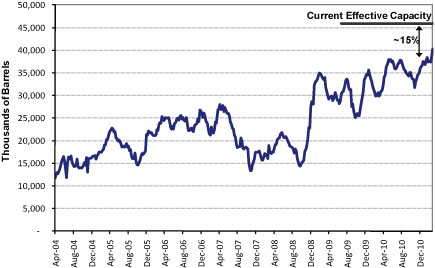
Source: US Department of Energy; Weekly Cushing, OK Ending Stocks excluding SPR of Crude Oil (Thousand Barrels); current effective storage capacity as of September 2010; all other data are from April 9, 2004 through March 4, 2011.
Either much stronger demand or transport capacity out of Cushing is needed to relieve the pressure. While demand is likely to rise along with an improving economy, industry experts do not believe that alone will solve the bottleneck. More likely, relief will need to come from pipeline capacity additions.
The biggest capacity addition on the horizon is TransCanada’s Keystone XL expansion scheduled for start-up in 2013. The expansion will add a line from Cushing to the Gulf Coast (and export markets), with expected capacity of 700 kb/d, expandable to 900 kb/d. However, the project has faced major political opposition in the US given the current post-Macondo regulatory climate, and TransCanada recently announced a delay in completion due to permitting and regulatory approval issues. There are other proposed pipeline projects that could be pushed forward, but the earliest feasible completion date would be 2014. As such, it’s possible relief in Cushing could take longer than expected.
Some companies are benefiting from the anomaly, like mid-continent refiners whose feedstock costs have been lowered. Others have been hurt, like exploration and production companies with significant assets in these regions. But ultimately, the differential is likely ephemeral—a short-term phenomenon driven primarily by infrastructure issues in one small region of the US, not by the larger (and more powerful) global drivers of supply and demand that set crude oil prices.
Sources: US Department of Energy, company filings, Thomson Reuters.
If you would like to contact the editors responsible for this article, please message MarketMinder directly.
*The content contained in this article represents only the opinions and viewpoints of the Fisher Investments editorial staff.
Get a weekly roundup of our market insights
Sign up for our weekly e-mail newsletter.

You Imagine Your Future. We Help You Get There.
Are you ready to start your journey to a better financial future?

Where Might the Market Go Next?
Confidently tackle the market’s ups and downs with independent research and analysis that tells you where we think stocks are headed—and why.
Related Resources
-
Expert Commentary This Week in Review | Market Volatility, Energy Markets, US Inflation
 2026-03-13
 -
Market Analysis Due Diligence and the DOL’s DOA Fiduciary Rule2026-03-13
-
In The News Oil prices will be lower in 6 months than when Iran conflict began, Ken Fisher argues2026-03-12
-
Environmental, Social and Governance Insights Responsible Investment Newsletter 20262026-03-11


Learn More
Learn why 195,000 clients trust us to manage their money and how Fisher Investments and its affiliates may be able to help you achieve your financial goals.
As of 12/31/2025
New to Fisher? Call Us.
Contact Us Today