Personal Wealth Management / 2020 Election
Cutting Through 2020 Election Fears
Headlines make hyperbolic claims about both parties’ potential market impact, but the reality is likely to be far more benign.

Editors’ note: MarketMinder is nonpartisan, favoring no party or politician, as political bias blinds and leads to investment mistakes. Our sole purpose here is to analyze the election’s potential economic and market impact.
With elections moving into high gear and polarized rhetoric hitting fever pitch, all the sound and fury might be a bit disorienting. But this is a normal part of the election cycle—and nothing that we think should prompt hasty portfolio moves. While it may not seem like it, markets are very good at sifting through possibilities and whittling them down to probable outcomes as November nears. That falling political uncertainty usually provides a tailwind for stocks, in our view, and 2020 should be no different.
When fears abound, it is crucial to keep perspective. Admittedly, this can be hard, especially when pundits—and campaigns—are prone to spinning extreme scenarios to attract attention and voter interest. At a partisan level, the hype and fear seems to go both ways. Some warn Democratic candidate Joe Biden would preside over the most leftwing agenda since FDR if he were to win and his party took Congress, dooming markets. Even though Biden’s platform left out some of the more contentious proposals floated during the primaries, including Medicare for All, it did include several items championed by his more progressive challengers. On the other side, many envision President Donald Trump doubling down on his China stance, upending global commerce and supply chains (not to mention starting a new cold war). There is growing fear that the TikTok and WeChat bans are only the tip of the iceberg, and that Chinese retaliation will damage American businesses in China heavily in a second Trump turn.
To us, this seems overwrought—presidents usually talk big on the campaign trail, then moderate once in office. Look no further than the last two administrations’ signature legislation: President Obama’s 2010 Affordable Care Act (ACA) and President Trump’s 2017 Tax Cut and Jobs Act (TCJA). Congress watered down both of them substantially from both presidents’ initial proposals, ditching some of the more extreme planks in order to break through intraparty gridlock. The ACA ultimately omitted its much-touted public option. The TCJA’s original radical simplification of personal income taxes into just three brackets didn’t make it through committee.
For markets, while extreme campaign rhetoric may raise fear and uncertainty in the short term, actions matter most. Every new president takes office with big ideas and big promises. But once the reality of governing sets in, they generally moderate—partly because that is the only way to get anything through Congress, and partly because their chief priority is re-election, which requires not alienating independent voters with radical new laws. So the key question for stocks, always, is this: What is the likelihood of sweeping legislation that creates winners and losers, alters property rights or makes everyday commerce more difficult? On this front, both parties have presided over policies that stocks have liked and disliked. This is why we think neither party—nor any politician—is good or bad for stocks.
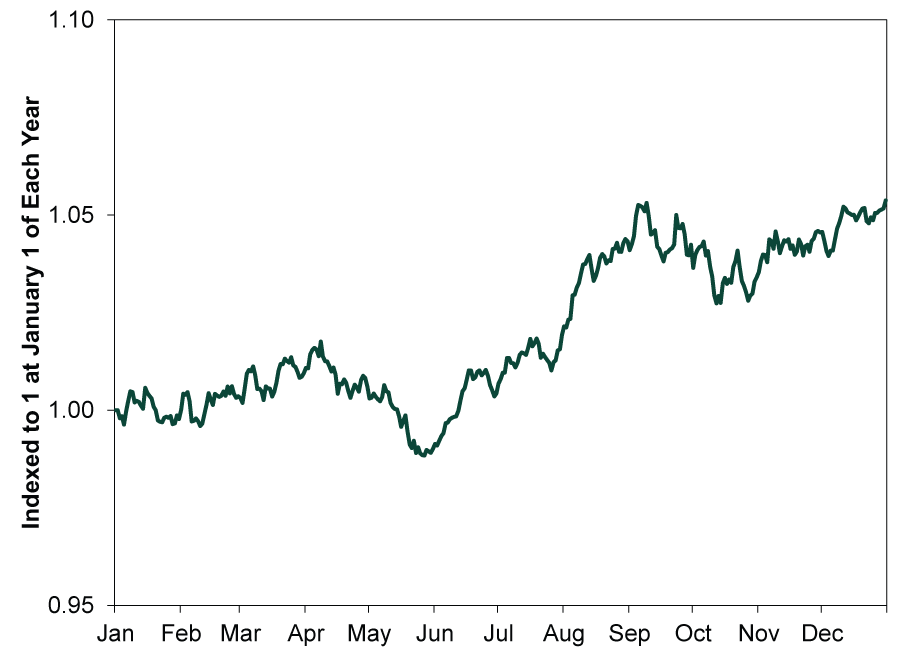
With that said, there are some powerful trends that can help put the next several months into perspective. For one, stocks normally rise in election years, but most of the gains come late. (Exhibit 1) This year, the S&P 500 fell -4.0% through June, not far from election years’ usual flattish first half.[i] But in the second half, stocks rise about 5% on average in price-only terms (which we use for this analysis since daily total return data don’t go back suitably far).[ii] Since 2020’s halfway mark, the S&P 500 is up 7.4%.[iii]
Exhibit 1: S&P 500 Price Returns in an Average Election Year
Source: Global Financial Data, as of 1/21/2020. S&P 500 price returns in election years, 12/31/1928 – 12/31/2019. Price returns used in lieu of total due to data availability.
In general, as races take shape, markets dissect candidates’ plans, gauging their potential passage and effects. This increases clarity, which we think helps buoy stocks as the year progresses. We don’t see any reason for stocks to deviate from the general script this time, short-term volatility notwithstanding. Love or loathe either candidate’s rhetoric, we think their proposals (and the public reaction to those proposals) help markets digest the contest. Polls and fundraising stats—for the presidential and congressional campaigns—then help markets determine whether the headline proposals stand a reasonable chance of becoming law. This falling uncertainty is, to us, a regular tailwind, but investors’ biases and emotions blind them to it. Hence its staying power hasn’t diminished over time, in our view.
While we don’t think either party is superior for stocks, investors’ biases can impact returns’ timing. In our experience, most American investors perceive GOP presidents as “pro-business.” In election years when a Democratic candidate wins, stocks typically see below-average—but still-positive—returns as markets fear (deservedly or not) them taking anti-business stances. However, in their inaugural years, market returns tend to jump, as the new president moderates. For Republicans taking office, the opposite usually occurs. Stocks see a steeper ascent in election years when a GOP candidate wins, anticipating business friendly policies. But they encounter headwinds from dashed expectations the following year when officials must water down or ditch hoped-for legislation. Exhibit 2 puts some numbers to this trend.
Exhibit 2: Perverse Inverse
Source: Global Financial Data, Inc., as of 10/22/2018. S&P 500 total return in election and inaugural years, 1928 – 2017.

This year there will either be a newly elected Democrat or a re-elected Republican. In these cases, the general pattern still holds. (Exhibit 3) However, election year returns are more subdued for incumbent Republicans—we think because they are a known quantity. Newly elected Democrats appear to have a modest downward effect, though. It may seem tempting to think markets see them more as a danger—with subsequently more relief and upside when bogged down in office. But their negative election-year average is entirely a function of 2008’s and 1932’s bear markets, neither of which really hinged on the election. In the three other instances since 1932, stocks rose. That is a small data set, but it should show you a Democratic win doesn’t mean automatic negative returns this year. Plus, even if there was, history suggests a bigger inaugural year bounce, canceling it out and then some. Crucially, since WWII, there has only been one negative first-term inaugural year: former President Jimmy Carter’s in 1977. But at -7.4%, it wasn’t very negative, either.[iv]
Exhibit 3: Perverse Inverse Returns Even Out Over Two Years
Source: Global Financial Data, Inc., as of 7/15/2020. Based on S&P 500 total returns, 12/31/1925 – 12/31/2017.

Some who fear a Biden win argue it is different this time, citing his allegedly leftwing agenda. However, sentiment toward Biden today strikes us as awfully similar to what investors claimed about former Presidents Barack Obama in 2008 and Bill Clinton in 1992. We heard many a warning that then-Senator Obama would push socialism and sink stocks to much deeper lows in the wake of the financial crisis. Of course, that didn’t happen. Stocks soared in 2009, beginning a bull market that ran throughout Obama’s presidency and well into Trump’s first term. Similar fears reigned when Clinton entered office in 1993—centering on his own healthcare proposals. But the S&P 500 rose 10.1% in 1993, and the economy and markets boomed for the rest of the decade.[v]
So by all means, engage politically, follow debates and track polling. Just don’t let that dominate your investment process.
[i] Source: FactSet, as of 9/11/2020. S&P 500 price return, 12/31/2019 – 6/30/2020.
[ii] Source: Global Financial Data, Inc., as of 1/21/2020. S&P 500 price returns, 12/31/1928 – 12/31/2019.
[iii] Source: FactSet, as of 9/11/2020. S&P 500 price return, 6/30/2020 – 9/11/2020.
[iv] Source: Global Financial Data, Inc., as of 1/14/2020. S&P 500 total return, 12/31/1976 – 12/31/1977.
[v] Source: FactSet, as of 9/11/2020. S&P 500 price return, 12/31/1992 – 12/31/1993.
If you would like to contact the editors responsible for this article, please message MarketMinder directly.
*The content contained in this article represents only the opinions and viewpoints of the Fisher Investments editorial staff.
Get a weekly roundup of our market insights
Sign up for our weekly e-mail newsletter.

You Imagine Your Future. We Help You Get There.
Are you ready to start your journey to a better financial future?

Where Might the Market Go Next?
Confidently tackle the market’s ups and downs with independent research and analysis that tells you where we think stocks are headed—and why.
Related Resources
-
Weekly Wrap-Up Fisher Investments Reviews: Last Week in Markets—July 6 - July 102026-07-13
-
Expert Commentary 3 Things You Need to Know This Week | US Inflation, China GDP, US Retail Sales
 2026-07-13
 -
Expert Commentary This Week in Review | Global PMIs, SpaceX, RMD Planning
 2026-07-10
 -
Market Analysis Trim Your Angst on Economic Measurement Tweaks2026-07-09


Learn More
Learn why 210,000 clients trust us to manage their money and how Fisher Investments and its affiliates may be able to help you achieve your financial goals.
As of 6/30/2026
New to Fisher? Call Us.
Contact Us Today