Personal Wealth Management / Economics
Explaining the UK’s Worst-in-the-World Q2 Contraction
Monthly figures offer a more nuanced view.

UK GDP fell -20.4% q/q in Q2, which is not only the worst contraction in the country’s history, but also the worst of the major nations reporting thus far.[i] That is the headline news you may have seen in your Internet travels. What lies under the hood is rather more interesting, though. Because the UK reports monthly GDP as well as quarterly, we have more granular results to show how the timing of the country’s gradual reopening affected GDP, which can help set expectations for what comes next. While we think stocks are likely looking way beyond 2020 economic data, getting a sense of how growth is occurring can help you stay cool in the face of dire headlines.
Exhibit 1 shows the scorecard of major developed nations’ Q2 GDP reports. Japan, Australia and Canada haven’t yet reported, but it seems unlikely any will take the dubious distinction as worst of the lot away from Britain, which was relatively more locked down during Q2 than the others. Once again, we show both quarter-over-quarter and annualized results for all countries, in order to make comparison easier.
Exhibit 1: The Q2 GDP Scorecard
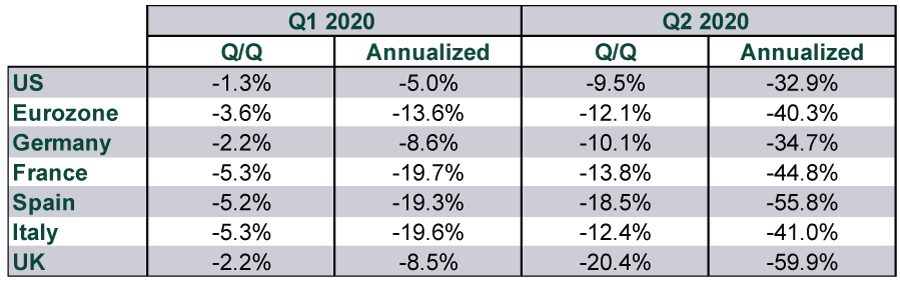
Source: FactSet, as of 8/12/2020.
The most striking aspect of the UK’s dismal result, in our view, is the fact that on a monthly basis, May and June were positive. After falling -6.9% m/m in March and -20.0% in April, GDP rose 2.4% m/m in May and 8.7% in June.[ii] In other words, the huge Q2 contraction—skewed by a horrible April—masked a nascent spring rebound.
The UK’s economic composition and lockdown timing explain most of this, in our view. The country didn’t lock down until March 23—the last major Western nation to do so. Restrictions started easing in May, but at a glacial pace. Factories were the first to get the greenlight, in the middle of that month, with new social distancing protocols. But because manufacturing was only around 15% of UK GDP during normal times, reopening factories did little more than help output stabilize in May.[iii]
The vast majority of UK economic activity—80% or so in normal times—is services.[iv] That includes retail, hospitality, financial services and personal care, just to name a few. The service sector didn’t begin reopening until June 15, when non-essential retailers got the green light. Pubs, restaurants and hair salons returned on July 4, followed by the beauty industry on July 15. The delayed reopening of the non-retail service sector had a rather large impact on June’s results: While retail services output jumped 27.0% m/m, the broader service sector clawed back just 7.7%.[v] That was far behind manufacturing (11.0% m/m) and construction (23.5%).[vi]
To complicate matters further, the timeline above applied to England only. Northern Ireland’s timeline largely echoed England’s, with some businesses even opening a few days sooner. But Wales and Scotland were much more hesitant. In Scotland, non-essential retailers didn’t reopen until June 29. Hair salons, restaurants, pubs and childcare centers didn’t get the go-ahead until July 15. As for Wales, retailers reopened on June 22, followed by restaurants, pubs and hairdressers on July 13.
With this timeline in place—and with only Leicester and the greater Manchester area dealing with renewed restrictions—a big July services rebound wouldn’t surprise. Nor would a Q3 rebound that dwarfs Continental Europe, where restrictions started easing weeks earlier. We aren’t saying GDP is at all likely to be back at breakeven by September’s end, but we suspect the country will look like much less of an outlier by then.
While this is all interesting from a global economic forecasting standpoint, we don’t think it is terribly meaningful for UK stocks at this juncture. While US stocks are flirting with record highs, UK stocks are only about halfway back from the low—much like the rest of Europe. We think this is primarily a function of market composition. Tech and Tech-like growth stocks are leading this bull market higher. The UK has a strong bent toward Financials, Materials and Energy—all classic value plays. That bias probably weighs on the UK and Europe unless and until a genuine sector or style leadership shift takes hold, and we don’t see any factors supporting that materializing in the foreseeable future. Not with the flattish global yield curve weighing on banks’ profit margins as well as credit available for value-oriented companies. We don’t think global investors benefit from avoiding these areas, as that would impede diversification, but we think it is wisest to focus on the largest, more growth-oriented companies, with value exposure serving to diversify and avoid overconcentration.
[i] Source: FactSet, as of 8/12/2020.
[ii] Source: UK Office for National Statistics, as of 8/12/2020.
[iii] Ibid.
[iv] Ibid.
[v] Ibid.
[vi] Ibid.
If you would like to contact the editors responsible for this article, please message MarketMinder directly.
*The content contained in this article represents only the opinions and viewpoints of the Fisher Investments editorial staff.
Get a weekly roundup of our market insights
Sign up for our weekly e-mail newsletter.

You Imagine Your Future. We Help You Get There.
Are you ready to start your journey to a better financial future?

Where Might the Market Go Next?
Confidently tackle the market’s ups and downs with independent research and analysis that tells you where we think stocks are headed—and why.
Related Resources
-
Corporate Information How You Benefit from Fisher Investments' Transparent Fee Structure
 2026-07-08
 -
Market Analysis On the Iran Flare Up2026-07-08
-
Expert Commentary 3 Things You Need to Know This Week | Midterm Miracle, US Jobs, Tax Planning
 2026-07-07
 -
Weekly Wrap-Up Fisher Investments Reviews: Last Week in Markets—June 29 - July 32026-07-07


Learn More
Learn why 210,000 clients trust us to manage their money and how Fisher Investments and its affiliates may be able to help you achieve your financial goals.
As of 6/30/2026
New to Fisher? Call Us.
Contact Us Today