Personal Wealth Management / Market Analysis
How Not to Tell a Correction From a Bear
GDP, unemployment and other backward-looking data can’t predict stocks.

Over these last couple weeks, we have seen a couple of telling themes in the media’s reaction to stocks’ sharp pullback. In a sign of how much sentiment has improved in recent years, many agree it is just a flesh wound, as the boys in Monty Python might say—a temporary blip, not the start of a full-blown bear market. Compare that reaction to mid-2013, when everyone thought a “taper tantrum” that began when Ben Bernanke first alluded to winding down quantitative easing would spiral into another financial crisis—even though stocks didn’t even reach correction territory. So that’s nice. Less nice, however, is why many outlets argue stocks should keep doing well. The common refrain? “The economy is still growing! Unemployment is low! Wages are growing! We aren’t in recession!” These are all true statements. But they ignore a key point: Markets look forward, not backward. To assess whether a drop is a correction or a bear market, you can’t rely on backward-looking data.
While it is true that bear markets usually pair with recessions, they generally don’t start simultaneously. Stocks are a leading economic indicator. Bear markets usually begin months before recessions do. See Exhibit 1, which compares bear market and recession start dates since 1926.
Exhibit 1: Bear Markets Usually Begin Well Before Recessions Do
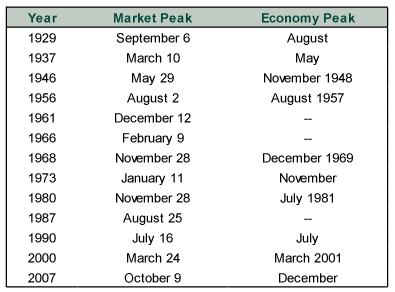
Source: FactSet and National Bureau of Economic Research, as of 2/13/2018. S&P 500 Index daily price level, 1926 – 2016.
Stocks also tend to peak long before employment does.
Exhibit 2: Nonfarm Payrolls and Bear Markets
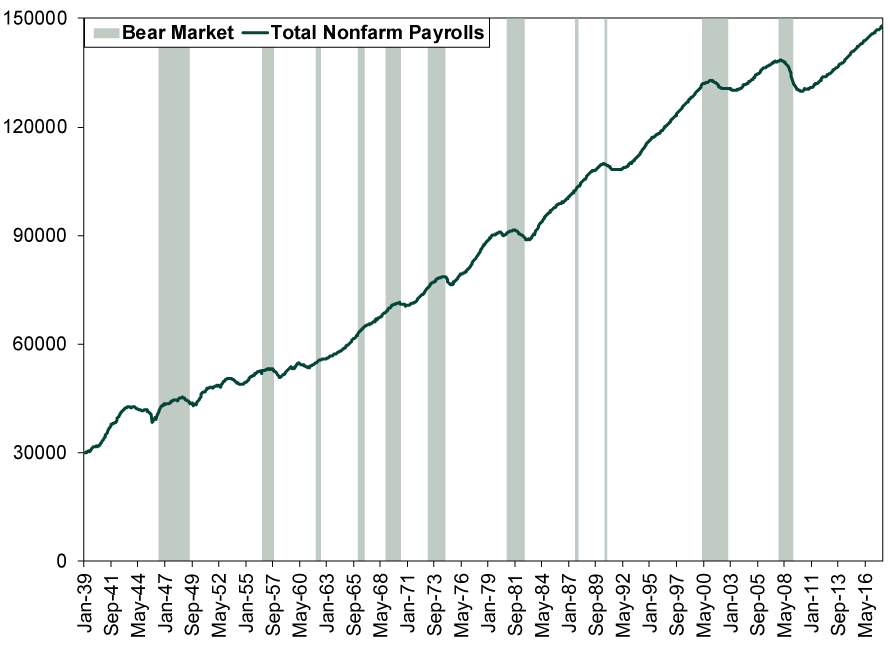
Source: FactSet, as of 2/13/2018. Monthly nonfarm payrolls and S&P 500 Index daily price level, January 1939 – January 2018.
If you wait for confirmation of a recession before declaring a bear market, you could very well be too late to make it worth your while. While nailing the market’s peak isn’t necessary (or, in our view, possible), getting out is wise only if there is still a high likelihood of significant downside to come. Keep in mind, recessions are visible only in hindsight. Because economic indicators are variable from month to month and quarter to quarter, a recession usually isn’t apparent until several months in, when it becomes clear conditions are broadly deteriorating and it isn’t a blip. At that point, you could be six, eight or more months into a bear market. Some bears last long enough that this is still an attractive exit point—2000 comes to mind—but some are nearly over by the time a recession announces itself.
If avoiding part of a bear market is your aim, you must use forward-looking economic indicators to gauge whether a recession is likely to develop—not backward-looking measures of past output and employment. The Leading Economic Index is the flagship, as it aggregates 10 mostly forward-looking economic variables. It doesn’t predict stocks, as stocks are one of its 10 components, but it can help you gauge whether market volatility is noise or a signal of more serious economic trouble to come. The yield curve, which is also in LEI, is another good gauge. When it inverts (short rates exceeding long) and stays that way for a chunk of time, it usually means credit will tighten within the next several months—and tighter credit usually causes business activity to fall. Other timely signs of trouble would probably be a sustained drop in manufacturing orders, a lengthy slide in the new business component of ISM’s non-manufacturing PMI and a broad drop in lending. These generally aren’t as forward-looking as market-based indicators, but they can precede drops in actual output.
Then again, this is all more art than science. There is such a thing as a recessionless bear, as 1987, 1966 and 1961 remind us. There is also such a thing as a bearless recession, which happened in 1953, 1960 and early 1980. After all, economics are only one market driver—political conditions (e.g., legislative and regulatory risk) and sentiment have heavy influence, too. This is why we regularly remind readers bear markets begin one of two ways: the wall or the wallop. Either sentiment climbs all the way up the wall of worry, where euphoric investors have too-high expectations for future corporate profits, or something huge, ugly and broadly unseen wallops the bull market before sentiment runs its natural course.
This isn’t to say you should ignore economic data. They can be very useful in identifying trends, confirming your earlier outlook or adding to your understanding of a key input for stocks. But when markets get rocky, as they have been lately, solid GDP and employment numbers should be no comfort. Take heart instead in the positively sloped yield curve, high-and-rising LEI, modest loan growth, strong new orders/new business readings and relatively low legislative risk thanks to gridlock. These, not backward-looking data, are what point to a continued bull market for the foreseeable future.If you would like to contact the editors responsible for this article, please message MarketMinder directly.
*The content contained in this article represents only the opinions and viewpoints of the Fisher Investments editorial staff.
Get a weekly roundup of our market insights
Sign up for our weekly e-mail newsletter.

You Imagine Your Future. We Help You Get There.
Are you ready to start your journey to a better financial future?

Where Might the Market Go Next?
Confidently tackle the market’s ups and downs with independent research and analysis that tells you where we think stocks are headed—and why.
Related Resources
-
Market Analysis New Tax Year, More British Business Tax Fear2026-04-08
-
Market Volatility How Investors Should Think About the Ceasefire2026-04-08
-
Market Analysis Quick Hit: What to Make of Jobs Data’s Persistent Swings2026-04-07
-
Weekly Wrap-Up Fisher Investments Reviews: Last Week in Markets—March 30 - April 32026-04-06


Learn More
Learn why 200,000 clients trust us to manage their money and how Fisher Investments and its affiliates may be able to help you achieve your financial goals.
As of 3/31/2026
New to Fisher? Call Us.
Contact Us Today