Personal Wealth Management / Market Analysis
Making Sense of Credit Spreads
Tightening credit spreads have some worried about a bubble in the bond markets, but healthy credit markets and historical perspective suggest fears are overblown.

This summer, former Fed head Alan Greenspan gave voice to many folks’ fears by stating bond markets were frothy—a bubble was “about to break.” In the intervening two months, headlines piled on, with most pointing to super-low corporate and high-yield bond interest rates as their evidence. This, they presume, has facilitated a record year of corporate bond issuance. But rates alone don’t tell the whole story. Credit spreads provide a frame of reference and a more complete picture when evaluating bond markets. Currently, yield spreads are somewhat tight, but not abnormally so: Tightening credit spreads are normal at this point in the market cycle and can persist for years.
Credit spreads—the difference in yield between government bonds and corporates of the same maturity—are closely watched by bond investors. Corporate bonds nearly always yield more than high-quality sovereign debt—since companies can’t print money and don’t have the ability to tax, they are seen as carrying more default risk. But the perception of risk fluctuates during the market cycle—that’s where credit spreads come in. When spreads are widening, investors are demanding extra compensation for corporates’ increased risk of default—which often coincides with equity bear markets.
The flipside is also true. During expansion, spreads generally tighten across the credit spectrum—from the most highly rated corporates to high-yield or “junk” bonds. Exhibit 1 shows high-yield and corporate spreads during the past couple market cycles. For all the talk of a “bond bubble,” which implies irrational demand and unsupported high prices, spreads were lower for much of the 2002—2007 equity bull market and the mid-to-late 1990s. Investors then were bidding corporate bonds even higher, relative to Treasurys … soooooo, were bonds in a bubble then, too? Or is it perhaps just normal for credit spreads to narrow as an expansion runs on and investors gain confidence in corporations’ abilities to honor their debts?
Think about what an extended expansion means for corporations: Growth generally brings rising earnings and revenues, helping improve balance sheets. At the risk of stating the obvious, profitable firms tend to default less frequently. Yield is the reward for taking risk, so if default risk is lower, investors will typically demand less of a premium—both on an absolute level and relative to other alternatives, like Treasurys.
Exhibit 1: Credit Spreads During Recent Market Cycles
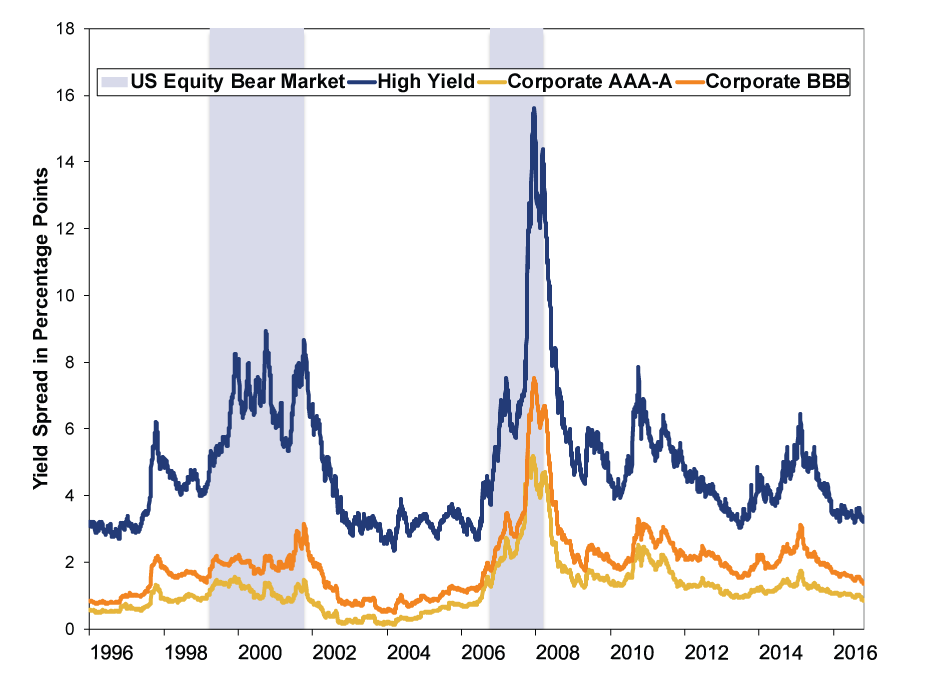
Source: FactSet, as of 10/24/2017. ICE BofA Merrill Lynch US 7-10 Year High-Yield Index, ICE BofA Merrill Lynch 7 – 10 Year US Treasury, ICE BofA Merrill Lynch US Corporate 7 – 10 Year AAA-A, ICE BofA Merrill Lynch US Corporate 7 – 10 Year BBB Index, 12/31/1996 – 10/23/2017.
While many presume low yields are driving corporate profitability—and we’re sure that’s true to an extent—it works the other way, too. Despite naysayers’ fears, strong profits and sales have persisted over this bull market and generally improved corporate creditworthiness. S&P 500 quarterly earnings per share have more than tripled since the first quarter of 2009 and have averaged 11% annual growth through 2016.a href="#endref1">[i] Revenues per share are up 27% over the same period.[ii] Earnings and sales growth is driving balance sheet health improvements. One hint at that: As has been well documented in this cycle, Corporate America is flush with cash. Profitable businesses with ample liquidity aren’t big default risks.Exhibit 2: Corporate Cash Levels
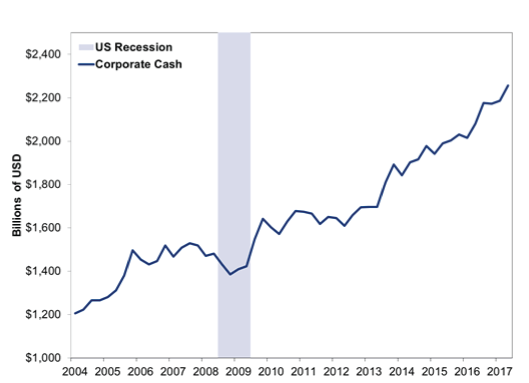
Source: Federal Reserve, as of 10/26/2017. Financial Accounts of the United States, Nonfinancial corporate business liquid assets, from 3/31/2004 – 6/30/2017. Recession dating is as per the National Bureau of Economic Research.
Most analysts expect earnings growth to continue—and rightfully so, in our view. Most forward-looking indicators—like the yield curve, The Conference Board’s Leading Economic Index, purchasing managers’ index new orders gauges and more—suggest it will. In turn, this should bolster investor confidence, sales and profit growth—and keep yields low.
Such strong financial health has reduced concern about defaults—and, it seems, justifiably so. Earlier this month, the cost of insuring against default in investment grade bonds touched 10-year lows. High-yield bond insurance costs are also historically low. Meanwhile, US high-yield and investment-grade default rates remain near cycle lows. Standard & Poor’s reported a combined US default rate of 2.1% at 2016’s close and forecasts defaults to fall to 1.5% by the end of 2017. And while a spike in defaults in early 2016 heightened fears for some high-yield investors, those were largely concentrated in the commodities space as weak energy companies felt the pinch of low oil prices.
Exhibit 3: High-Yield Default Rates During Recent Market Cycles
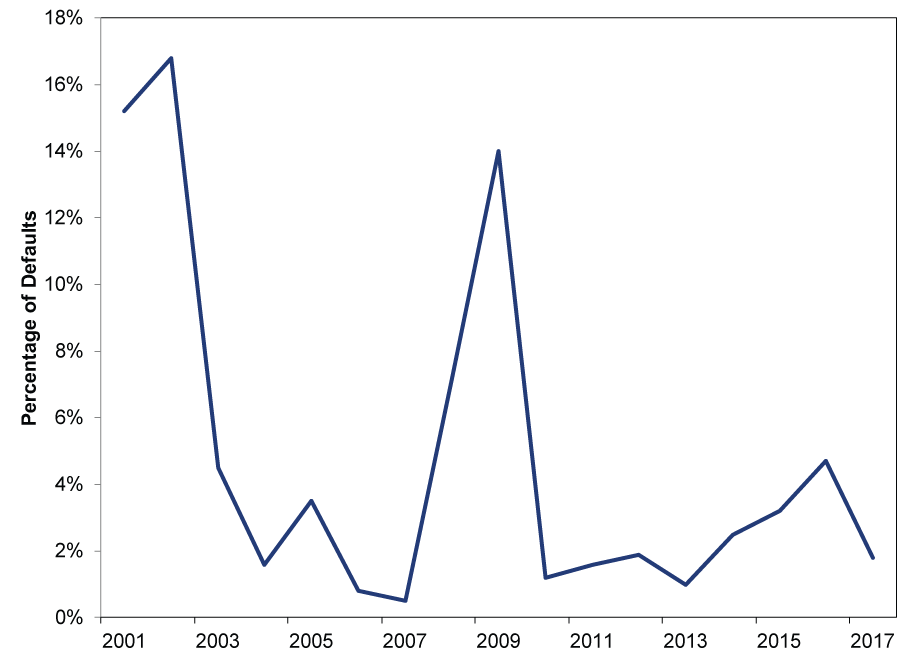
Source: Fitch as of 10/24/2017. High-Yield Default Index, 1/1/2001 – 8/31/2017.
Outside commodities industries, high-yield bond defaults rose only slightly—and have since retreated. Looking ahead, with the weakest commodity-related borrowers having already defaulted and oil prices stabilizing, Energy-related defaults aren’t as likely to resume. That suggests the common fear of Energy causing a wave of defaults is unlikely to materialize any time soon.
In our view, a lot of the fear around bond yields being irrationally low is more a signal of lingering skepticism than anything else. Those who more accurately perceive the positive factors contributing to falling yield spreads can better appreciate the bright reality around them.
[i] Source: Standard and Poor’s, as of 10/24/2017
[ii] Ibid
If you would like to contact the editors responsible for this article, please message MarketMinder directly.
*The content contained in this article represents only the opinions and viewpoints of the Fisher Investments editorial staff.
Get a weekly roundup of our market insights
Sign up for our weekly e-mail newsletter.

You Imagine Your Future. We Help You Get There.
Are you ready to start your journey to a better financial future?

Where Might the Market Go Next?
Confidently tackle the market’s ups and downs with independent research and analysis that tells you where we think stocks are headed—and why.
Related Resources
-
In The News In Orbit? On Tech Sentiment and IPOs2026-05-22
-
Market Analysis Global Bond Calamity Calls for Calm Perspective2026-05-22
-
Expert Commentary This Week in Review | UK Politics, Fed Developments, IPOs
 2026-05-22
 -
Market Analysis CPI Sheds Light on Britain’s Price ‘Cap’ Conundrum2026-05-20


Learn More
Learn why 200,000 clients trust us to manage their money and how Fisher Investments and its affiliates may be able to help you achieve your financial goals.
As of 3/31/2026
New to Fisher? Call Us.
Contact Us Today