Personal Wealth Management / Retirement
Making Sense of Prices in These COVID Times
Are COVID-impacted prices reason for investors to worry?

Last week the US July Consumer Price Index (CPI) posted its biggest monthly gain since 1991. While the year-over-year inflation rate was 1.0%, which is quite low by historical standards, some posited inflation is running hotter than what the national CPI says—implying COVID-19 fallout has resulted in a much higher cost of living than widely reported.[i] We found this an opportunity to discuss what inflation gauges do and don’t tell us—an important consideration for investors, especially those planning for retirement expenses.
CPI tracks how prices of consumer goods and services change over time. Several agencies have their own price gauges, but headlines usually focus on the BLS’s CPI. To measure CPI, the BLS monitors a basket of goods and services—updated annually—that aims to represent the spending patterns of US urban consumers, about 93% of the population.[ii] Besides its national index, the BLS also has CPIs for different metropolitan areas (e.g., Greater Houston in Texas) and geographical regions (Northeast, Midwest, South, and West).
Many see the monthly CPI report and say their experience doesn’t match it, implying the government must be underreporting inflation. Yet CPI isn’t intended to measure an individual’s personal cost of living. The BLS states this outright:
A cost-of-living index is a conceptual measurement goal, however, and not a straightforward alternative to the CPI. A cost-of-living index would measure changes over time in the amount that consumers need to spend to reach a certain utility level or standard of living. Both the CPI and a cost-of-living index would reflect changes in the prices of goods and services, such as food and clothing that are directly purchased in the marketplace; but a complete cost-of-living index would go beyond this role to also take into account changes in other governmental or environmental factors that affect consumers' well-being.[iii]
To see why the national CPI isn’t indicative of individuals’ experiences, consider its most recent category weightings.
Exhibit 1: CPI Weightings (US City Average)
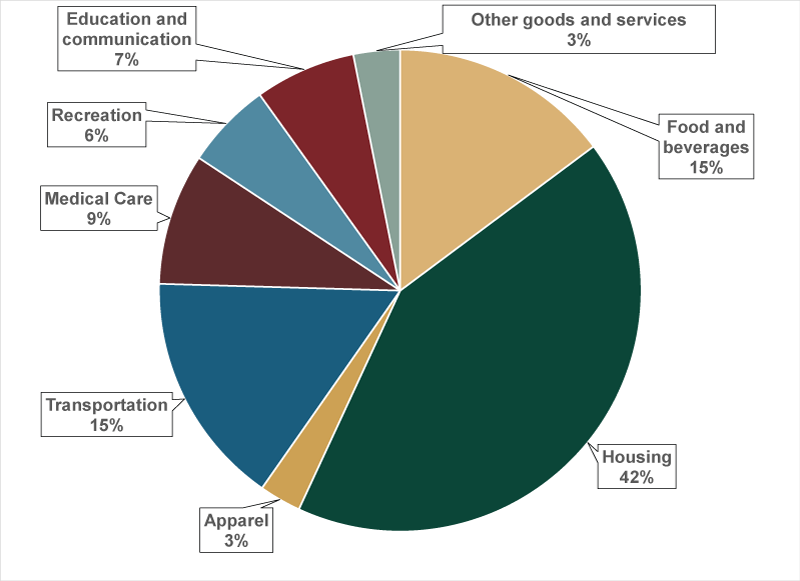
Source: BLS, as of 8/17/2020. Category weightings last updated December 2019.
These weightings will vary based on where you live. On a regional level, for example, the West’s housing weighting is 44%, but for the San Francisco metropolitan area, it is 53%.[iv] Different goods and services experience different inflation rates, too. Consider the average annual inflation rate over the past 20 years for several common expenditures.
Exhibit 2: Consumer Prices for Select Expenditures
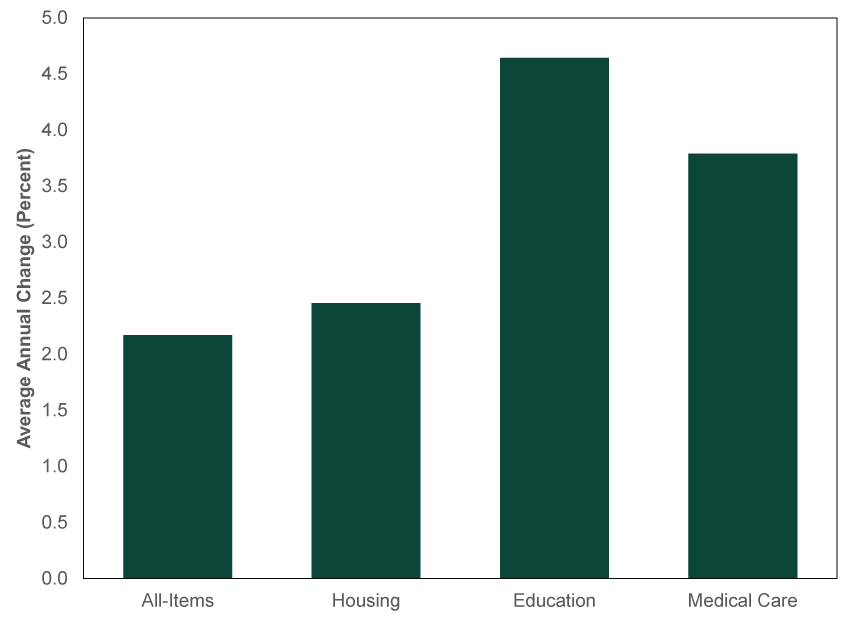
Source: FactSet, as of 8/18/2020. Average annual percent change for CPI All-Items, Housing, Tuition, School Fees & Childcare, and Medical Care Services, 2000 – 2019.
Your personal cost of living depends on the goods and services you consume most. A single professional who owns her own home in Portland, OR won’t face the education-related costs a family of four in Dallas, TX may be paying. Housing or tuition may not matter as much to a retired couple in Tampa Bay, FL who own their home free and clear—yet they may spend more on medical care. In the San Francisco Bay Area, where housing costs have famously soared over time, a renter and homeowner with otherwise identical expenses would have wildly different personal cost of living increases, as the former would have been subject to rising rents. But CPI wouldn’t capture this because it includes imputed rent—the amount a homeowner would pay to rent their own home. That is a phantom cost that people don’t actually pay. National, regional and metropolitan CPIs are useful for policymakers trying to track prices across the broad economy, but they won’t capture every individual or household’s cost of living.
Narrower CPIs try to address this, but even they aren’t perfect. The BLS’s CPI for consumers over age 62—released publicly for the first time this month—has risen faster than headline CPI over the past two decades.[v] That might ring true for seniors, who are generally more exposed to medical care’s relatively faster price increases. In our experience, those increases play a big role in people’s perceptions of the mismatch between CPI and their own cost of living. But even within this age bracket, individual expenses aren’t uniform. A couple in their mid-60s who plan to travel extensively won’t spend like an octogenarian who wants to fund her grandchildren’s education. Likewise, a retiree who stays at a home they own will have different costs than someone who lives in a retirement community with full amenities. For those planning for cash flows in retirement, it is important to map out your expenses and look at their relative inflation rates.
One-off events can have a noticeable impact on prices, too. As headlines have noticed, the COVID-driven economic shutdown has caused grocery prices to jump.
Exhibit 3: Consumer Prices for Food at Home, July 2018 – July 2020
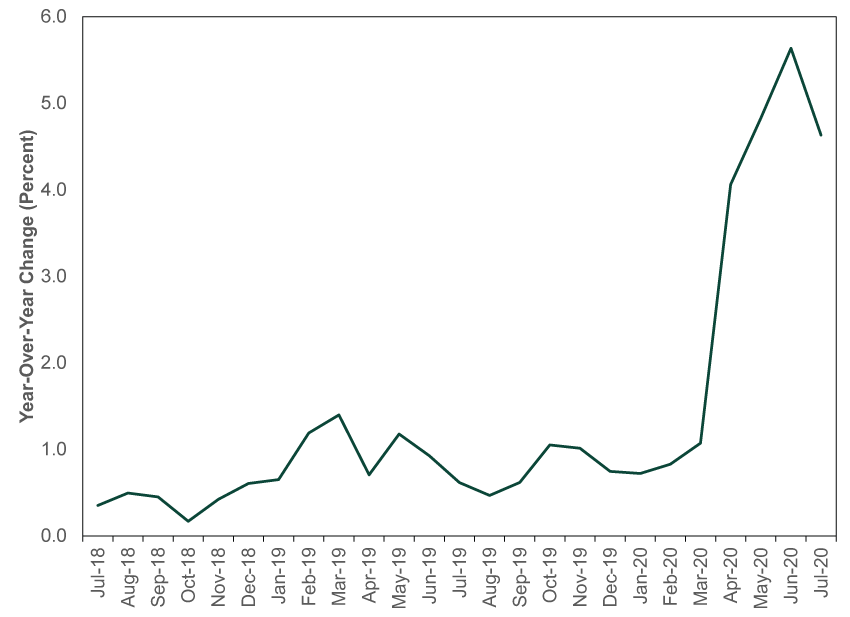
Source: FactSet, as of 8/19/2020.
Yet the year-over-year change obfuscates COVID’s big, but fleeting, effect. Compare this to the changes on a monthly basis.
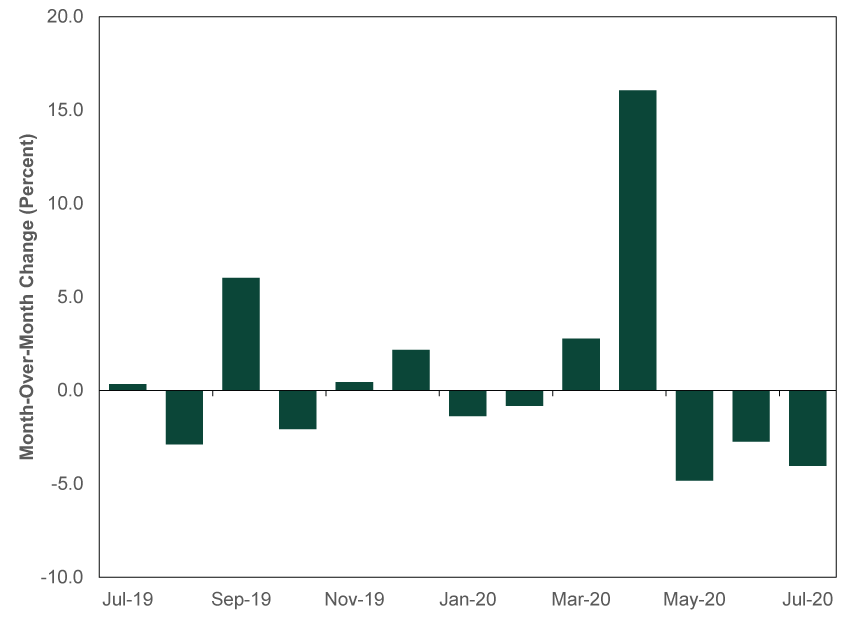
Exhibit 4: Consumer Prices for Food at Home, July 2018 – July 2020
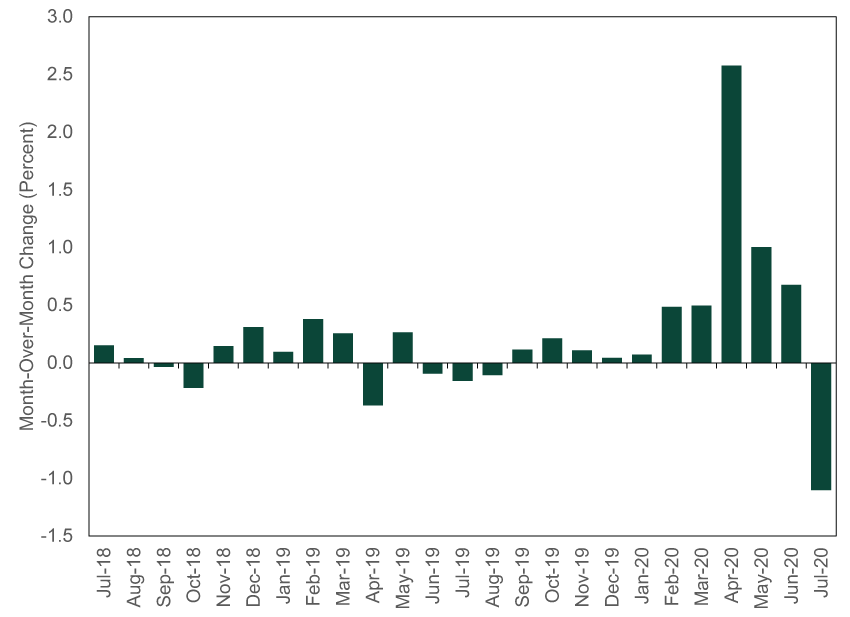
Source: FactSet, as of 8/19/2020.
Prices spiked in April, reflecting the shortage in certain goods as folks stocked up for the COVID-driven lockdown and participated in a national baking binge. But producers responded to meet that demand—which grocery prices from May through July reflect. Egg prices nicely illustrate this. (Exhibit 5) High prices prompted farmers to buy more chicks in the spring. Those chicks are now maturing into laying hens, easing the shortage and helping prices fall.
Exhibit 5: Consumer Prices for Eggs, July 2019 – July 2020
Source: FactSet, as of 8/19/2020.
Moreover, short-term spikes or drops in food prices aren’t just a COVID-19 phenomenon. Food prices soared in the early part of the last decade due to adverse weather events. In 2010 - 2011, drought and dry weather hurt crops globally, lifting food prices in 2011.[vi] Similarly, a historic US drought in 2012 sent animal-feed prices to record highs and forced farmers to cull herds—which caused meat and dairy product prices to rise in 2014.[vii] Yet both times, the shortage in meat and other food categories didn’t cause prices to climb in perpetuity—here, too, producers responded to demand, which eventually drove prices lower.
Exhibit 6: Consumer Prices for Food at Home and Meat, Poultry, Fish and Eggs, 2010 – 2016
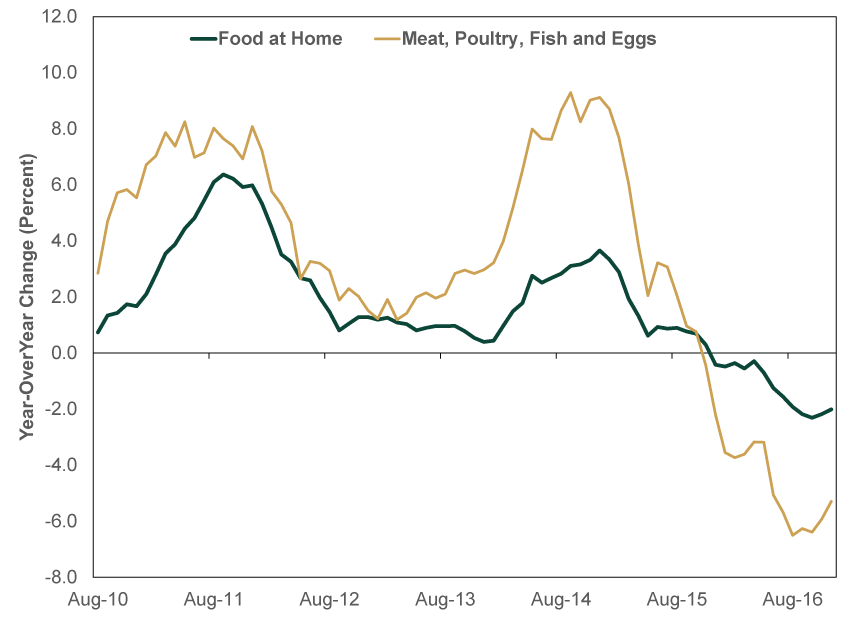
Source: FactSet, as of 8/20/2020. Consumer prices for food and meats, poultry, fish and eggs, year-over-year percent change, August 2010 – December 2016.
The COVID effect may cause CPI data to look wonky for a bit, but it doesn’t mean a permanent change in prices is underway. Keep that in mind as you plan for the costs most relevant to your life.
[i] Source: BLS, as of 8/20/2020.
[ii] “Consumer Price Index Frequently Asked Questions,” BLS, as of 8/20/2020.
[iii] Ibid.
[iv] See note i.
[v] “U.S. Inflation Is Even Higher for Consumers Who Are Over Age 62,” Alexandre Tanzi, Bloomberg, August 12, 2020.
[vi] “Why Another Food Commodity Price Spike?”, Ronald Trostle, United States Department of Agriculture, September 1, 2011.
[vii] “Food Prices Surge as Drought Exacts a High Toll on Crops,” Tony C. Dreibus, Leslie Josephs and Julie Jargon, The Wall Street Journal, March 18, 2014.
If you would like to contact the editors responsible for this article, please message MarketMinder directly.
*The content contained in this article represents only the opinions and viewpoints of the Fisher Investments editorial staff.
Get a weekly roundup of our market insights
Sign up for our weekly e-mail newsletter.

You Imagine Your Future. We Help You Get There.
Are you ready to start your journey to a better financial future?

Where Might the Market Go Next?
Confidently tackle the market’s ups and downs with independent research and analysis that tells you where we think stocks are headed—and why.
Related Resources
-
Market Analysis Why the SOX “Bear Market” Isn’t Foreboding2026-07-21
-
Politics Blunting Burnham?2026-07-21
-
Expert Commentary 3 Things You Need to Know This Week | Q2 Earnings, ECB Meeting, Trump Accounts
 2026-07-20
 -
Weekly Wrap-Up Fisher Investments Reviews: Last Week in Markets—July 13 - July 172026-07-20


Learn More
Learn why 210,000 clients trust us to manage their money and how Fisher Investments and its affiliates may be able to help you achieve your financial goals.
As of 6/30/2026
New to Fisher? Call Us.
Contact Us Today