Personal Wealth Management / Economics
Seven Charts to Free You From Skepticism’s Shackles
Gauges of tangible activity in the US economy show this expansion is driven by more than just the Fed's attempted financial engineering.

Is the bull market illusory?
Five-plus years into this economic expansion, some still say yes. They commonly claim growth and the bull market are pumped up by global central bankers' allegedly easy money. They wag an accusatory finger at the Fed in particular, for pinning overnight rates at zero and enacting widely misunderstood "extraordinary" monetary policy they claim is stimulus (despite a century of theory and data arguing the opposite). Some even argue the economy has fundamentally mutated as a result and a rate hike will be disastrous for stocks and the economy. That the Fed's financial engineering has created a recovery limited to only those with fortunes already invested in markets. Broader growth, they claim, is built on a shaky foundation. For these reasons and more, many skeptics remain unconvinced the bull market is for real-and when volatility strikes like it did Thursday (a relative rarity this and last year)-they presume it is not just markets being their unpredictable, occasionally wild, selves. They presume it is the beginning of the end they've long envisioned. But in our view, there are plenty of hard, fast data points that show growth isn't exclusive to a few stock jobbers[i] and financial market players. Some were featured in a recent post we saw on Scott Grannis' Calafia Beach Pundit blog. Others we've added. These more tangible data points are beyond the Fed's ability to skew. None are wonderful indicators of future growth, but taken together, they are an excellent illustration of the reality underpinning this bull market.
Let's start with oil production. The US shale revolution has fundamentally transformed the industry from being in long-term decline to a sharp revival. Combining three long-known factors-shale oil resources, hydraulic fracturing and horizontal drilling-unearthed massive, previously untapped oil. Today, domestic oil production has surged to levels not seen since 1988. Once down more than 50% from its highest-ever oil output recorded in October 1970, oil production today stands about 17% below that mark.
Exhibit 1: Monthly US Oil Production, Thousands of Barrels
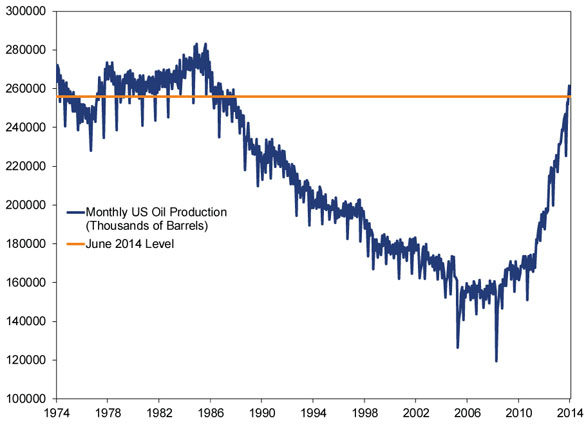
Source: Energy Information Administration, July 1974 - June 2014.
One state at the forefront of this boom is North Dakota, where the Bakken Shale region has become one of only 10 oil fields in the world to produce more than 1 million barrels per day. Since the recession ended in June 2009, North Dakota output has spiked and presently stands at levels more than five times those from just five years earlier. Oil output has doubled since January 2012. Unsurprisingly, jobs have followed this rising output.
Exhibit 2: North Dakota Monthly Oil Production (Thousands of Barrels) and North Dakota Total Nonfarm Payrolls
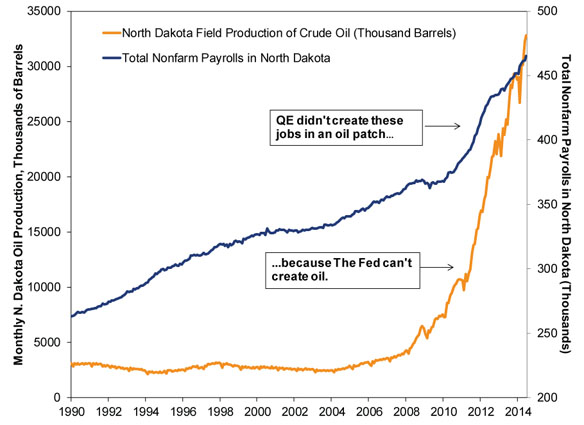
Sources: Energy Information Administration and the Federal Reserve Bank of St. Louis, January 1990 - June 2014.
Now, a lot of investors will fixate on the two charts above and think they argue for investing heavily in Energy firms, but they don't. Energy revenues and profits are more price than volume sensitive, and big volume increases tend to depress prices. We share these more as a way to illustrate that American ingenuity and innovation wasn't warped by Fed policy-it is alive and well. And those jobs are probably not being held down exclusively by the superrich, we're betting.
One key to a growing economy, now as ever, is transporting goods from point A to another point, let's call it B. A very cost efficient way to accomplish this move? Trains. And intermodal rail traffic-shipping containers transferable from ship to truck or train-is up sharply since the recession ended. Railroad employment has eclipsed its prerecession peak. We are betting the newly hired workers aren't responsible for moving a larger number of empty cars.
Exhibit 3: Intermodal Rail Traffic, Quarterly
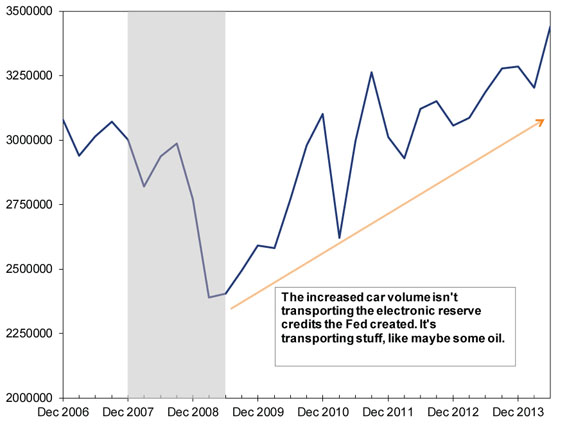
Source: FactSet, American Association of Railroads. Quarterly intermodal rail traffic. Shaded area is US recession, as defined by the National Bureau of Economic Research (NBER), the official people who date recessions. Which we are sure is great fun.
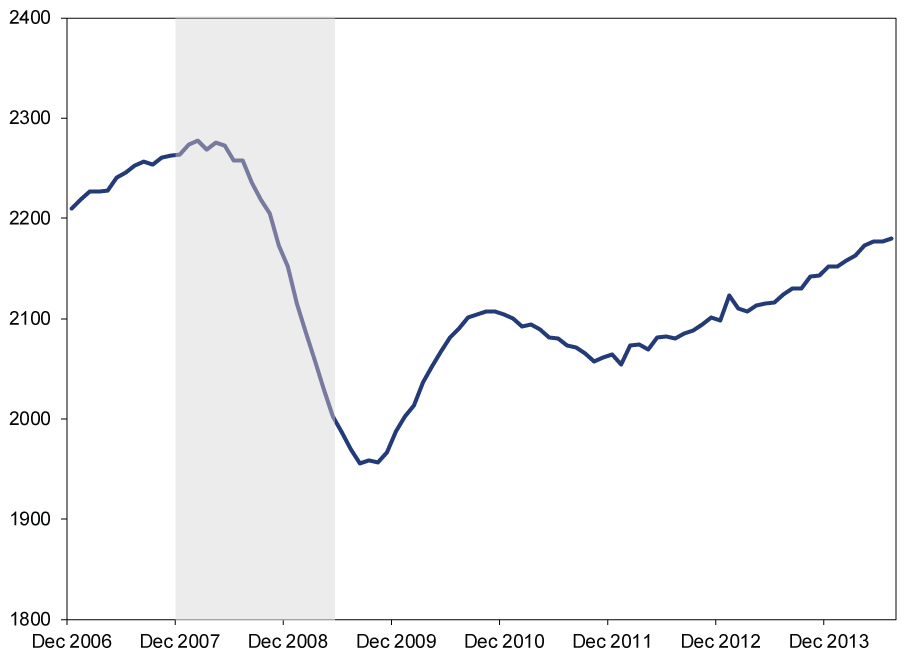
Exhibit 4: US Total Railroad Employment
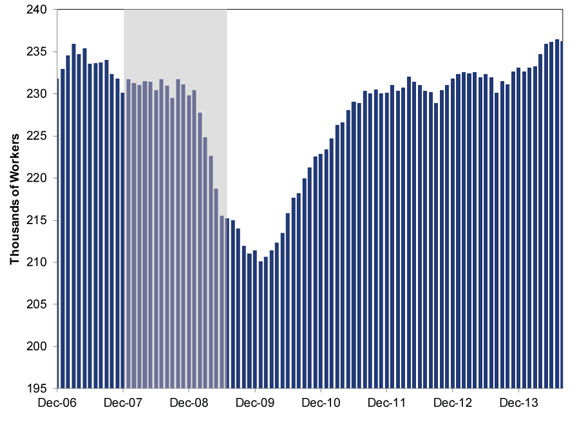
Source: US Bureau of Labor Statistics, December 2006 - August 2014. Shaded area is US recession defined by those NBER people again.
How else can you move things from point A to point B? You could walk, but that is very inefficient.[ii] Or you could use trucks and planes! Exhibit 5 plots US domestic air freight ton kilometers (FTK, a measure of air freight traffic factoring in both the quantity of goods and distance covered). The trend, while irregular, shows growth.
Exhibit 5: Rolling 12-Month Average Domestic Air Freight Traffic, Freight Ton Kilometers (Thousands)
Source: Factset, International Air Transport Association, December 2006 - August 2014. Shading is US recession according to, you guessed it, NBER!
Trucks, however, move about 70% of goods shipped in America (according to the American Trucking Association, ATA). And the ATA's Truck Tonnage Index shows freight moved via member companies is currently 17% above where its pre-recession level. (Exhibit 6) With freight movement on the rise, so are sales of big trucks. (Exhibit 7)
Exhibit 6: ATA Truck Tonnage Index, Indexed to 100 at December 2007
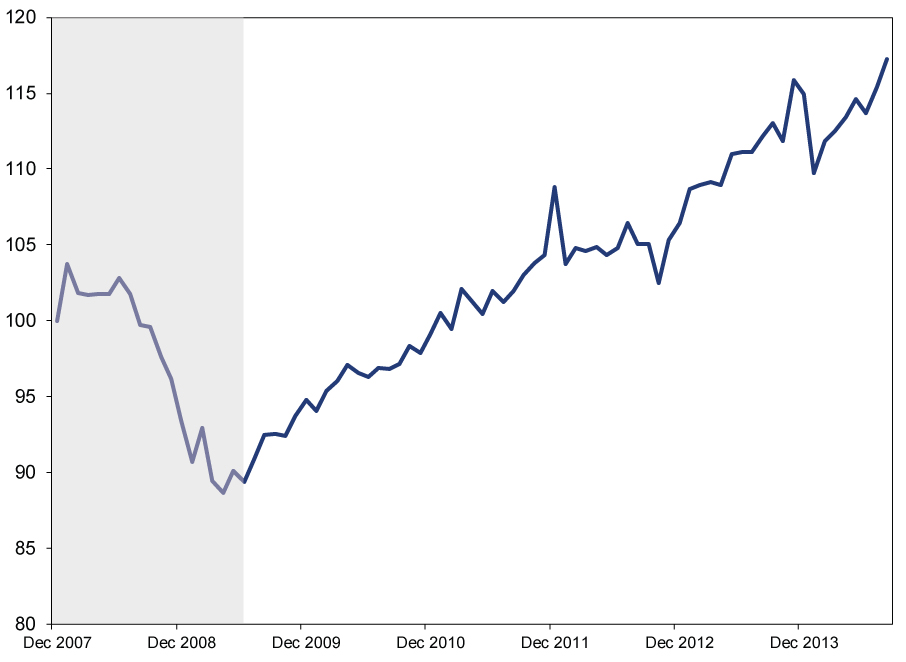
Source: Bloomberg, American Trucking Association. December 2007 - August 2014. Shading is US recession according to a different organization, the Economic Cyc-aww who are we kidding, it's the same recession daters, NBER.
Exhibit 7: Heavy Truck Sales (Over 14,001 Lbs. Gross Vehicle Weight)
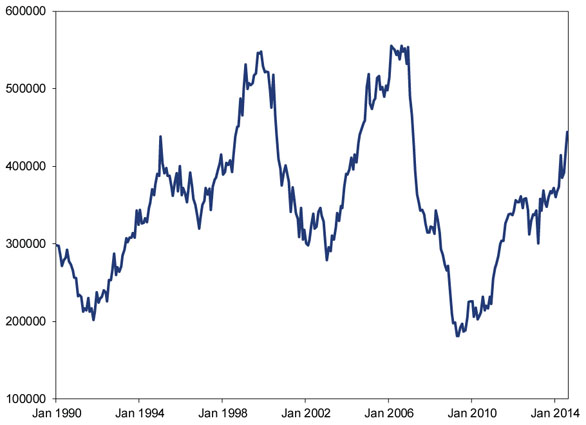
Source: Factset, January 1990 - August 2014.
On October 16, 2008-nearly six years ago-legendary investor Warren Buffett wrote an op-ed in The New York Times, titled, "Buy American. I am." In it, he argued that despite the panic, the fundamentals of the American markets and economy were sound. Last week, in an interview with Bloomberg, Buffett said, "America comes back, it always comes back." Buffett was right then. Still is, to us! America's economic revival is not built on sand. It's not crafted, created or steered by politicians, central bank people and other officials. No, not everyone has equally benefited from this expansion. But that also, unfortunately, includes the skeptics who choose to look past the data that would otherwise free them of bias.
Stock Market Outlook
Like what you read? Interested in market analysis for your portfolio? Why not download our in-depth analysis of current investing conditions and our forecast for the period ahead. Our latest report looks at key stock market drivers including market, political, and economic factors. Click Here for More!
[i] This is an ancient derogatory term for speculators, itself a derogatory term for Wall Street players, which itself has become derogatory. You can't win here.
[ii] Though it would virtually ensure full employment if we had to carry everything on foot from point A to point B.
If you would like to contact the editors responsible for this article, please message MarketMinder directly.
*The content contained in this article represents only the opinions and viewpoints of the Fisher Investments editorial staff.
Get a weekly roundup of our market insights
Sign up for our weekly e-mail newsletter.

You Imagine Your Future. We Help You Get There.
Are you ready to start your journey to a better financial future?

Where Might the Market Go Next?
Confidently tackle the market’s ups and downs with independent research and analysis that tells you where we think stocks are headed—and why.
Related Resources
-
Expert Commentary This Week in Review | Q2 Market Recap, June US Jobs, Trade Deal Update
 2026-07-03
 -
Market Analysis Why El Niño Doesn’t Necessitate Portfolio Shifts2026-07-01
-
Market Analysis Declaring Fed Independence Fears False2026-07-01
-
Market Analysis Reader Mailbag: June 20262026-06-30


Learn More
Learn why 200,000 clients trust us to manage their money and how Fisher Investments and its affiliates may be able to help you achieve your financial goals.
As of 3/31/2026
New to Fisher? Call Us.
Contact Us Today