Personal Wealth Management / Economics
Slowing Jobs Growth Won’t Derail a Recovery
History shows jobs data of all variations lag growth.
As the US economic recovery continues, some worry the latest jobs data signal trouble ahead. October’s jobs report showed ongoing hiring, but improvement in more timely weekly jobless claims has slowed. Others fret over the ramifications of rising long-term unemployment. These developments renew concerns of a “jobless recovery,” in which high unemployment tramples economic green shoots. However, we don’t think these are a sign investors should start bracing for problems. Jobs data aren’t only backward-looking, but today’s much ballyhooed trends aren’t out of line with history—important perspective for investors to keep in mind, in our view.
According to October’s Employment Situation Report, employers added 638,000 jobs—the sixth straight positive month. The private sector filled 968,000 jobs—offsetting the 268,000 drop in the public sector (largely related to the release of temporary census workers). The unemployment rate improved by a percentage point, from 7.9% to 6.9%—and down from April’s peak of 14.7%. While analysts acknowledged the ongoing improvement, plenty of concerns persist. With unemployment still high, worries about a “K-shaped” recovery—in which some workers recover while others struggle—are gaining ground, especially with the long-term unemployment rate soaring the past three months. Some argue more recent data—e.g., weekly jobless claims—show problems afoot. Though continuing jobless claims (which represent people who have already filed an initial claim) have improved for seven straight weeks, some argue this doesn’t tell the whole story, as people are simply migrating to other unemployment programs (e.g., the Pandemic Emergency Employment Assistance) after maxing out traditional benefits.
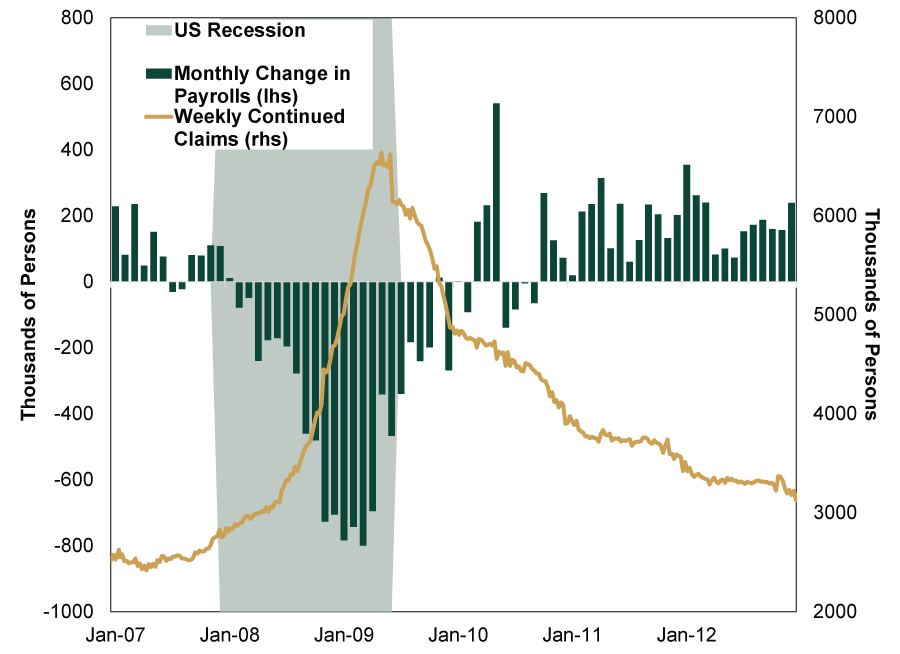
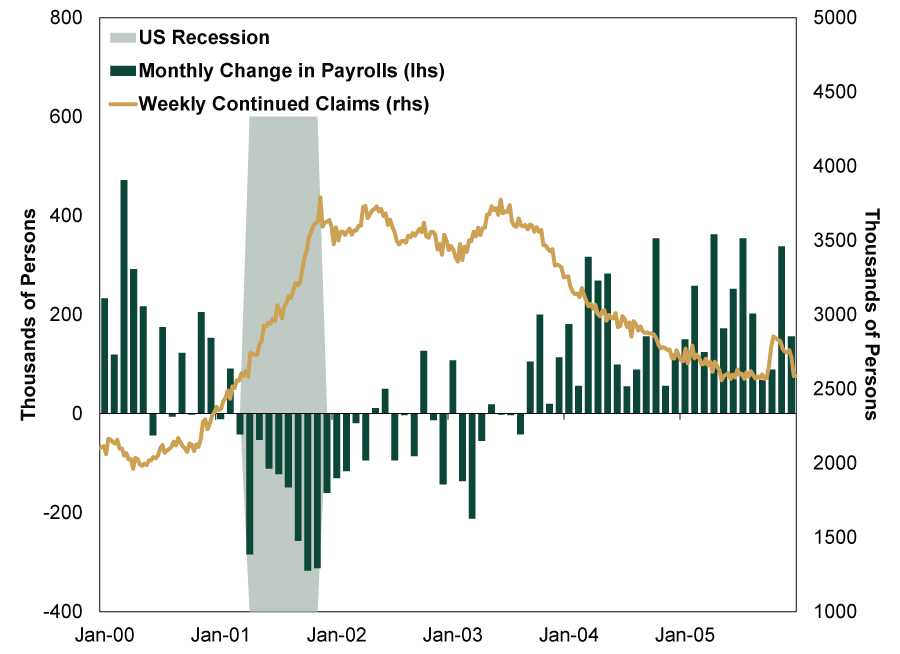
We aren’t saying the numbers are stellar, and we are empathetic to the personal hardships they reflect. But positive hiring cuts against the notion that falling continuing claims broadly signals folks falling through the cracks. This is also consistent with recent history. As the past two economic recoveries show, positive hiring and falling continuing claims aren’t perfectly aligned, but they roughly track each other. (Exhibits 1- 2)
Exhibit 1: Nonfarm Payrolls and Continued Claims, 2007 – 2012
Source: FactSet, Department of Labor and National Bureau of Economic Research, as of 11/6/2020. Monthly change in nonfarm payrolls, January 2007 – December 2012, and weekly continued claims, from week ending 1/27/2007 – week ending 12/29/2012. Recession dating based on National Bureau of Economic Research’s business cycle dating.
Exhibit 2: Nonfarm Payrolls and Continued Claims, 2000 – 2005
Source: FactSet, Department of Labor and National Bureau of Economic Research, as of 11/6/2020. Monthly change in nonfarm payrolls, January 2000 – December 2005, and weekly continued claims, from week ending 1/29/2000 – week ending 12/31/2005. Recession dating based on National Bureau of Economic Research’s business cycle dating.
As for concerns about a rising long-term unemployment rate, we don’t think this automatically signals trouble, either. To see this, understand that the rate reflects the percentage of the unemployed population that has been out of work for 27 weeks (about 6 months) or more. That invited big skew this time around, with the long-term unemployment rate plunging earlier this year. In April, 23.1 million people were idled anew by the pandemic, bringing the 939,000 long-term unemployed folks then to just 4.1% of total unemployment—the lowest since the late 1960s.[i] Quite obviously, that did not indicate labor market health. Now, with more people back to work, the 3.6 million people unemployed 27 weeks or more in October are an eye-popping 32.1%—hence the concerns.[ii] Some experts worry the longer workers are unemployed, the harder it is to get a job—kicking off a vicious cycle. But in our view, it is important to keep in mind that 27 weeks ago was right as lockdowns were destroying economic activity. Not all of those jobs have come back yet, and we don’t think anyone realistically expected them to.
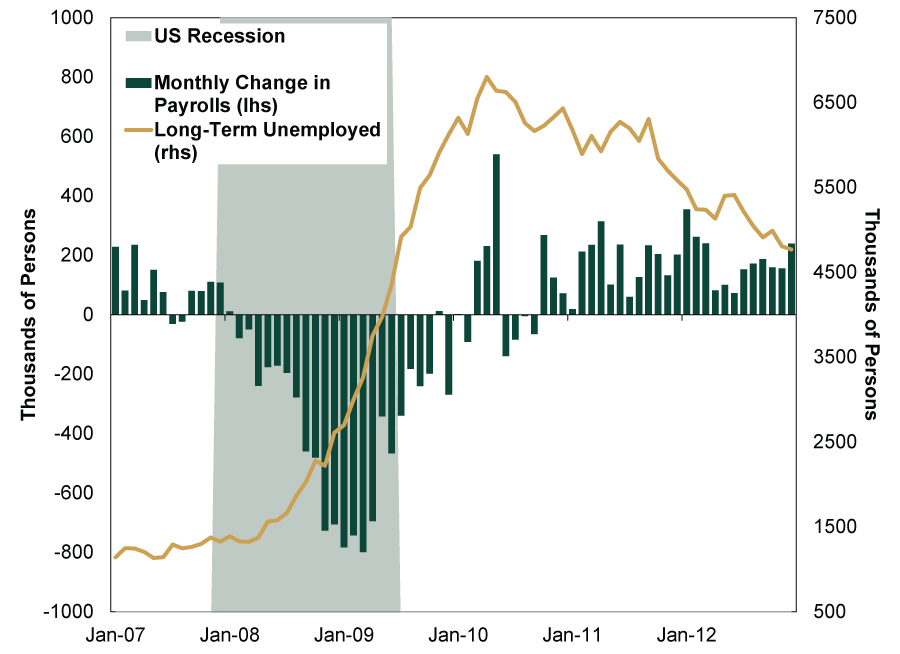
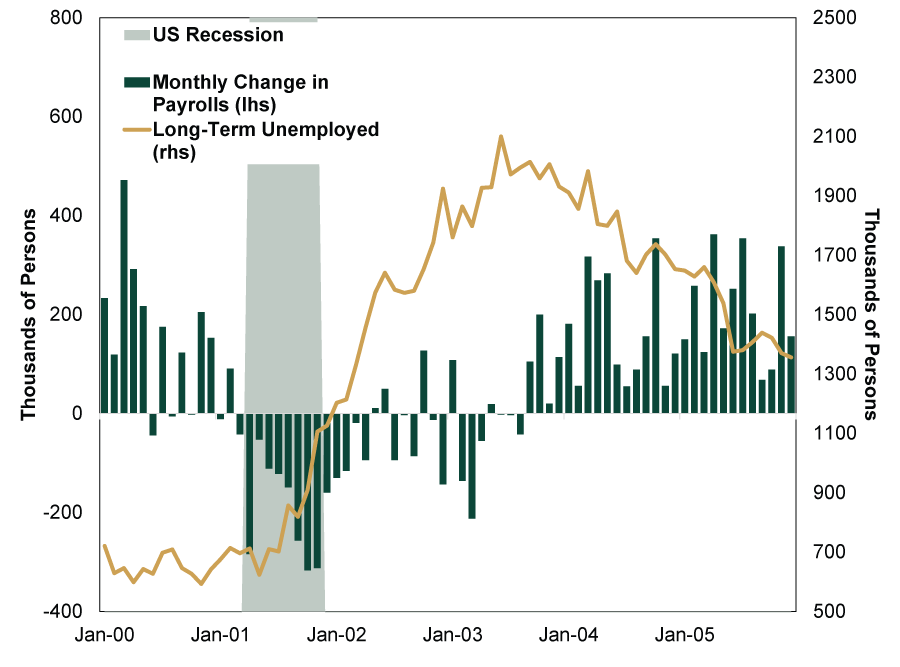
History offers some encouraging perspective here, too. In the past two recoveries, as monthly hiring picked up, the number of long-term unemployed fell. In the 2007 – 2009 recession’s aftermath, the number of long-term unemployed people hit a historically high 6.8 million, more than double today’s figure, representing 48.1% of the overall unemployed.[iii] (Exhibit 3) But the economic expansion eventually brought that number way, way down to just over a million before the pandemic struck. A similar trend, albeit less extreme, followed the 2001 recession. (Exhibit 4)
Exhibit 3: Nonfarm Payrolls and Long-Term Unemployment, 2007 – 2012
Source: FactSet, St. Louis Federal Reserve and National Bureau of Economic Research, as of 11/12/2020. Monthly change in nonfarm payrolls and monthly number of unemployed for 27 weeks & over, seasonally adjusted, in thousands of persons, January 2007 – December 2012. Recession dating based on National Bureau of Economic Research’s business cycle dating.
Exhibit 4: Nonfarm Payrolls and Long-Term Unemployment, 2000 – 2005
Source: FactSet, St. Louis Federal Reserve and National Bureau of Economic Research, as of 11/12/2020. Monthly change in nonfarm payrolls and monthly number of unemployed for 27 weeks & over, seasonally adjusted, in thousands of persons, January 2007 – December 2012. Recession dating based on National Bureau of Economic Research’s business cycle dating.
It didn’t happen immediately: Both hiring and the decline in long-term unemployed started well after the recovery officially began. But this illustrates how growth leads to jobs—even for the long-term unemployed.
This doesn’t mean today’s recovery will look exactly like past ones, especially with the COVID wildcard. Yet labor data remain late-lagging economic indicators. Our view of “jobless recovery” fears also remains the same. These concerns arise every recovery, and from a high level, they aren’t wrong: Every recovery is technically a jobless one. But that is because growth creates jobs, not the other way around. Moreover, forward-looking stocks have long moved on past this news—critical for investors to keep in mind.
[i] Source: St. Louis Federal Reserve, as of 11/12/2020. Monthly unemployment level and number of unemployed for 27 weeks & over, seasonally adjusted, April 2020.
[ii] Ibid. Monthly unemployment level and number of unemployed for 27 weeks & over, seasonally adjusted, October 2020.
[iii] Source: St. Louis Federal Reserve, as of 11/12/2020.
If you would like to contact the editors responsible for this article, please message MarketMinder directly.
*The content contained in this article represents only the opinions and viewpoints of the Fisher Investments editorial staff.
Get a weekly roundup of our market insights
Sign up for our weekly e-mail newsletter.

You Imagine Your Future. We Help You Get There.
Are you ready to start your journey to a better financial future?

Where Might the Market Go Next?
Confidently tackle the market’s ups and downs with independent research and analysis that tells you where we think stocks are headed—and why.


