Personal Wealth Management / Market Analysis
Small Stock Markets, Big Skew—Israel Edition
Lessons on diversification from Israel’s narrow national stock market.

Editors' Note: MarketMinder does not recommend individual securities. The below merely represent a broader theme we wish to highlight. Likewise, we favor no party nor any politician and assess politics solely for their potential market impact.
It seems a truth universally acknowledged that a fast-growing country with strong property rights and a vibrant startup culture must be a grand investment destination.[i] While we don’t necessarily disagree, we think investors should carefully consider the nuances of investing in smaller countries with few publicly traded firms. Unlike in huge economies—like the US’s, with its broad, deep, capital markets—factors like stock market structure and individual company concentration may drive returns much more than the country’s political or economic backdrop. A great example was in the news lately: Israel.
With the final vote tally in from last week’s election, incumbent Benjamin Netanyahu appears on track to start his fifth term as Prime Minister. However, his Likud party isn’t close to a majority of seats in the Knesset—Israel’s parliament—and will likely have to partner with at least four small parties with widely differing priorities in order to form a government. Meanwhile, Netanyahu faces potential indictment on corruption allegations—likely a distraction from legislating. Parliamentary division and distraction lower the probability of major laws passing—typically a tailwind for stocks, which dislike the uncertainty an active government brings. Israel’s strong economy is another ostensibly bullish force: GDP growth has averaged 3.4% y/y in a stretch of nearly uninterrupted expansion since Q1 2009.[ii] For comparison, OECD nations’ average GDP growth over that timespan is 1.6% y/y.[iii] Israel also boasts record-low unemployment, record-high incomes, a modest government deficit, a highly educated workforce and a thriving Tech startup scene.
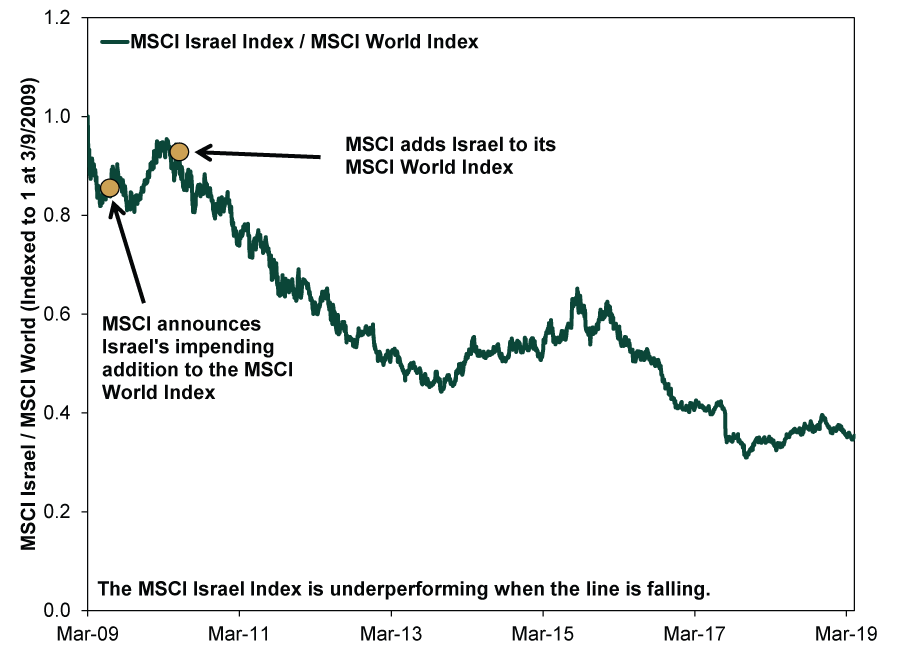
While all this may sound like a great recipe for outsized market returns, Israeli stocks have underperformed global by a significant margin during this bull market.
Exhibit 1: Israeli Stocks Lag Global
Source: FactSet, as of 4/16/2019. MSCI Israel Index return with net dividends and MSCI World Index return with net dividends, 3/9/2009 – 4/16/2019.
Past performance doesn’t predict, though. Maybe this long period of underperformance is an opportunity? Perhaps! But we think the more important questions are these: What makes up Israel’s stock market—and how do its constituents square with what is likely in favor globally?
By sector, Tech, Financials and Healthcare firms dominate, comprising 85.1% of the MSCI Israel’s market capitalization.[iv] For comparison, the top three MSCI World sectors (the same ones, incidentally) are a more reasonable 44.3% of the index.[v] While this doesn’t mean Israel’s economy is concentrated in these areas, they largely determine its stock market’s direction. Although the relationship between a nation’s economy and stocks is never perfect, high sector concentration can create significant divergences between the two. Other examples include Canada—where Energy and Materials loom much larger in its stock market than economy—and Australia, whose dominant Financials firms comprise 38.7% of its stock market and just 6.2% of GDP.[vi]
Second, Israel skews toward small cap, limiting investors’ ability to diversify across company sizes. The MSCI World—which has a weighted average market cap of $165 billion—sports a whopping 578 firms with a larger market cap than Israel’s biggest company.[vii] That would be Tech firm Check Point, which tips the scales at $15.8 billion—much closer to the MSCI World Small Cap Index’s weighted average of $3.6 billion.[viii] We aren’t saying large is always better—every style, size and category has its day in the sun and rain. But Israel probably does best when small cap leads and its main sectors are in favor. Other small country indexes may face similar skew, though in different directions depending on their makeup.
Watch out for outsized exposure to individual companies, too. The MSCI Israel contains all of 11 constituents, three of which comprise over half its market cap.[ix] Even the broader MSCI Israel Investable Market Index—which covers 99% of listed Israeli firms by market cap—holds just 67 companies.[x] This top-heaviness is common in narrower national indexes. For example, Health Care giant Novo Nordisk accounts for 37% of the MSCI Denmark; Anheuser Busch InBev is 47% of the MSCI Belgium; Equinor, Norway’s national Energy firm, is 26% of the MSCI Norway; and Nokia is 22% of the MSCI Finland.[xi] While not disqualifying, this means your view of Israeli stocks should probably incorporate a heavy dose of stock-specific analysis. Buying could also be an after-effect of a higher-level portfolio construction decision like “overweight small-cap international Tech.” If that is what you are looking for, some Israeli exposure might make sense. If not, maybe look elsewhere.
Perhaps Israel’s flashiest claim to fame is its reputation as an entrepreneurial hotbed—earning it the nickname, “Startup Nation.” While this piques many investors’ interest, it doesn’t necessarily reflect great buying opportunities. Most of the country’s startup successes stay private or sell themselves to existing (usually non-Israeli) companies.[xii] Some do go public—but even then, as Ken Fisher recently explained in USA Today, IPOs aren’t an automatic ticket to riches.
To be clear, we aren’t saying to avoid Israel and its ilk altogether—or in perpetuity. But we think investors would do well to consider the quirks of narrow national indexes—and avoid presuming economic growth and benign political forces automatically mean a country is a good buy.
[i] With apologies to Jane Austen.
[ii] Source: FactSet, as of 4/17/2019. Year-over-year percent change in Israeli GDP, Q1 2009 – Q4 2018.
[iii] Source: OECD, as of 4/17/2019. Year-over-year percent change in OECD member states’ cumulative GDP, Q1 2009 – Q4 2018.
[iv] Source: FactSet, as of 4/17/2019. MSCI Israel Index and constituent market capitalization.
[v] Ibid. MSCI World Index and constituent market capitalizations.
[vi] Ibid. MSCI Canada Index and constituent market capitalizations, MSCI Australia Index and constituent market capitalizations, and Australia finance subindustry output as a percentage of 2018 GDP.
[vii] Ibid, as of 4/15/2019. The weighted average market cap is the average market cap adjusted for each company’s weight in the index.
[viii] Ibid.
[ix] See Note iv.
[x] Source: FactSet, as of 4/17/2019.
[xi] Ibid.
[xii] “Here’s Why Only 2 Israeli Tech Startups Went Public Last Year,” Staff, Reuters, 1/5/2017.
If you would like to contact the editors responsible for this article, please message MarketMinder directly.
*The content contained in this article represents only the opinions and viewpoints of the Fisher Investments editorial staff.
Get a weekly roundup of our market insights
Sign up for our weekly e-mail newsletter.

You Imagine Your Future. We Help You Get There.
Are you ready to start your journey to a better financial future?

Where Might the Market Go Next?
Confidently tackle the market’s ups and downs with independent research and analysis that tells you where we think stocks are headed—and why.
Related Resources
-
Market Analysis Why “War Winner” Trades Are Off Base2026-03-20
-
Expert Commentary This Week in Review | Energy Markets, Fed Meeting, Earnings Reporting
 2026-03-20
 -
Market Analysis Around the World in Central Banking, Iran War Edition2026-03-19
-
Politics Beyond the War: A Political Roundup Covering America, Canada and Denmark2026-03-17


Learn More
Learn why 195,000 clients trust us to manage their money and how Fisher Investments and its affiliates may be able to help you achieve your financial goals.
As of 12/31/2025
New to Fisher? Call Us.
Contact Us Today