Personal Wealth Management / Market Analysis
S&P 500%
Some timely trivia and a timeless lesson.

History’s longest bull market hit a fun little milestone this week, when the S&P 500’s return with dividends crossed 500% on Wednesday and … no one noticed. On the surface, this shows three things. One: People aren’t looking for round numbers to hype—another sign sentiment remains in check. Two: Lots of finance reporters are on holiday break. Three: Most people probably look at price returns, which exclude dividends. Two of those three could be articles in their own right, but we found another angle slightly more fascinating and more helpful on a forward-looking basis.
Ever since the S&P 500 price index recaptured its October 2007 high in 2013, people have questioned how much further the bull could run.[i] Folks thought stocks had come too far, too fast after 2013 delivered a 32.4% total return.[ii] Investors have routinely feared the bull running out of gas ever since—during rallies and pullbacks alike. But the tank was far from empty, and now this bull is the second in modern history to punch through 500%—trailing only the 1990s’ bull in magnitude. (But exceeding it in length, highlighting what a grind it has been at times.) All those past milestones weren’t significant or predictive. They didn’t tell you anything about what came next, just as this one doesn’t.
The eye-popping cumulative return also shows the power of compounding. As Exhibit 1 shows, after the initial bounce, annual returns during this bull market weren’t exactly off the chart. Several were actually kinda blah.
Exhibit 1: Annual Returns During This Bull Market
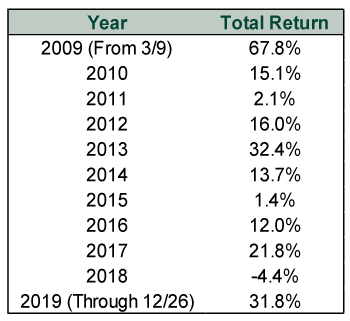
Source: FactSet, as of 12/27/2019. S&P 500 Total Return Index, 3/9/2009 – 12/26/2019.
This is more than just a math lesson. It is a life lesson. That 67.8% return from the bear market’s low through the end of 2009 is the foundation for everything that comes afterward. Someone who missed it didn’t just miss that 67.8%. They also missed the chance for returns in subsequent years to compound off a higher base. The missed opportunity adds up bigtime: The S&P 500’s total return since the end of 2009 is almost half the bull’s entire magnitude—257.6%.[iii]
To see the practical impact, consider two totally hypothetical people with $100,000 to invest in 2009. Jim decides to bite the bullet on March 9, thinking the bottom must be close (his timing is excellent). Bob decides to wait for confirmation that this is indeed a new bull market and sits out until New Year’s Eve. Assuming both bought the S&P 500 (no, you can’t buy an index, this is illustrative!), Jim would have $604,480 as of Thursday’s close. Bob would have $357,590. By waiting for clarity, he missed out on $246,890. That is one expensive security blanket.
Jim and Bob aren’t real. But a lot of folks did leave stocks at some point during the financial crisis, and many didn’t jump back in at the bottom. We have followed a number of news outlets’ personal finance sections over the past 11 years, and we have seen numerous tales of folks who were too nervous to get back into stocks right away. Some waited a year. Some two years. Some didn’t get back in until 2013. Some are still waiting. It makes for heart-breaking reading, but it highlights a crucial point: Stocks’ long-term returns don’t do you any good if you don’t capture them.
Similarly, cutting out of this bull market after it attained some early, arbitrary “high point” could be very costly. The S&P 500 Total Return Index has climbed 168.3% since its first all-time high in this bull market.[iv] There have been 313 others since, highlighting the fact arbitrary markers—and return magnitudes—have no bearing on where stocks go from here. So the next time a friend, colleague or neighbor suggests stocks can’t possibly keep going after hitting a record high or climbing for this long, remind them of this bull’s nearly 11-year long grind to 500% and 314 record highs (and counting).
[i] There, too, dividends got the short shrift, as the S&P 500 Total Return Index notched its first all-time high of this bull on April 2, 2012. (Source: FactSet, as of 12/27/2019.)
[ii] Source: FactSet, as of 12/27/2019. S&P 500 Total Return Index, 12/31/2012 – 12/31/2013.
[iii] Source: FactSet, as of 12/27/2019. S&P 500 Total Return Index, 12/31/2009 – 12/26/2019.
[iv] See note i.
If you would like to contact the editors responsible for this article, please message MarketMinder directly.
*The content contained in this article represents only the opinions and viewpoints of the Fisher Investments editorial staff.
Get a weekly roundup of our market insights
Sign up for our weekly e-mail newsletter.

You Imagine Your Future. We Help You Get There.
Are you ready to start your journey to a better financial future?

Where Might the Market Go Next?
Confidently tackle the market’s ups and downs with independent research and analysis that tells you where we think stocks are headed—and why.
Related Resources
-
Expert Commentary This Week in Review | Q1 Recap, Earnings Guidance, Elections
 2026-04-03
 -
Market Analysis A Forward-Looking Lesson One Year After Liberation Day2026-04-02
-
Market Volatility Some Timeless Counsel After March’s Volatility2026-04-01
-
Market Analysis Countertrends and Corrections: Banks in 2026’s Early Selloff2026-04-01


Learn More
Learn why 200,000 clients trust us to manage their money and how Fisher Investments and its affiliates may be able to help you achieve your financial goals.
As of 3/31/2026
New to Fisher? Call Us.
Contact Us Today