Personal Wealth Management / 2020 Election
Stocks’ September Seasonal Slide Is Sensationalized
Seasonal patterns still don’t predict returns.

September is here, and you know what that means for stocks—absolutely nothing! Yes, September’s status as the S&P 500’s worst month of the calendar year is legendary, and without fail, every calendar flip from August 31 to September 1 brings a litany of warnings as to why this year (whatever year it is) will make the seasonal pattern extra-bad. This time around, the logic appears to rest on election uncertainty and stocks’ supposed need to cool off after a torrid summer. Don’t buy it. Volatility is always possible, for any or no reason. But it also defies prediction, seasonal patterns or none.
Usually this is the point in our annual September article where we would show average S&P 500 returns by month to concede that, yes, September is the worst one and the only one with an average negative return. But in the spirit of shaking things up, we will skip straight to the “averages aren’t telling or predictive” section. Any calculation of average September returns will have scores of data points. Some, like Septembers in 1930, 1931 and 1937, were horrible. September 2008 was pretty darned bad, too. But all of these awful Septembers occurred during bear markets with deeply negative fundamental factors at work. The calendar was coincidental. Moreover, there have also been some very nice Septembers, including 1954 and 2010. Since good S&P 500 data begin in 1925, September has delivered positive returns about 55% of the time.[i] Ask yourself what is more meaningful: an average return dragged negative by a handful of terrible years? Or a history of rising more than half the time, suggesting the likelihood of a positive September is modestly higher than a negative one?
Not that historical probabilities mean September 2020 will be good. They don’t predict anything. They just show that avoiding stocks because of September’s negative historical average is faulty logic.
Layering negatives on top of seasonality is another annual rite of passage, so election year uncertainty and stocks’ allegedly having come “too far, too fast” don’t automatically make this month likely to join the September Hall of Shame. We recall seeing the too far, too fast argument back in September 2009. Then, stocks had soared off the bottom of a bear market that ended in March. (Sound familiar?) From March 9, 2009 through that August 31, the S&P 500 jumped 52.6%—not far removed from stocks’ return from this year’s low through August’s end, 57.7%.[ii] Back then, the gains continued in September 2009, with a 3.7% return.[iii] This, too, doesn’t dictate a positive September 2020. But it shows a negative month isn’t automatic.
Election-related uncertainty doesn’t strike us as a good reason to shun stocks this month, either. We have had 23 election-year Septembers since 1925. Of these, 8 were negative—and 15 were positive. In other words, the frequency of positive returns improves to 65% when you look only at election-year Septembers. We don’t find this terribly surprising, considering the run-up to the election is usually when uncertainty falls. Contrary to the arguments circulating through headlines now, uncertainty is usually highest early in an election year, when the primary fracas makes November’s outcome impossible to assign probabilities to. That usually weighs on returns in the first half of an election year. But then we get nominees and running mates, and uncertainty starts falling. As Senate races take shape, more clarity arrives. Then, in autumn, we start getting a good sense of each party’s ability to mobilize voters. This steady progression of falling uncertainty lifts returns in the back half of an election year, and September falls smack in the middle of it.
To see this another way, consider Exhibit 1, which shows stocks’ average election year path. The median return in the first half is 1.1%—not too far removed from this year’s -4.0% in the first half, even with the bear market in February and March.[iv] But then they heat up, leading to a back-end-loaded, positive year. At the risk of stating the obvious, to capture those oft-positive second-half returns, you must be invested during the second half.
Exhibit 1: S&P 500 Average Price Returns in Election Years, 1932 – 2016
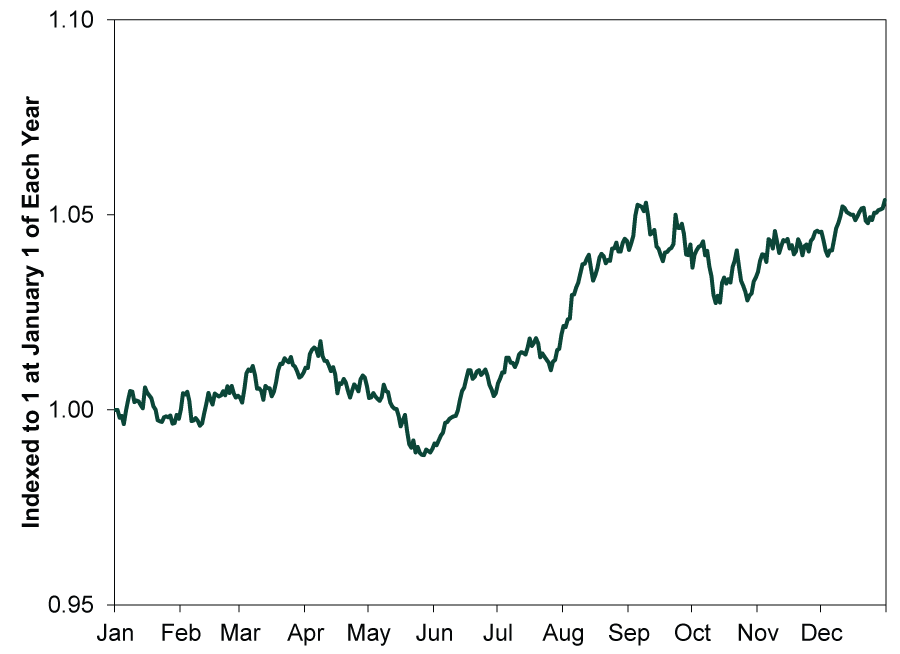
Source: Global Financial Data, Inc., as of 1/20/2020. S&P 500 Price Returns, 12/31/1928 – 12/31/2016.
Again, we aren’t trying to predict near-term returns. A down September 2020, even one that starts a correction (sharp, sentiment-driven drop of around -10 to -20%), is possible. But such short-term sentiment swings are unpredictable. They begin and end without warning. Rather than try to avoid one, we think investors benefit most from keeping a longer perspective, remembering bull market returns include the many corrections along the way, whether or not they occurred in September, and remembering those returns are the reward for having patience and discipline.
[i] Source: Global Financial Data, Inc., as of 9/1/2020. Frequency of positive S&P 500 returns in the month of September, 12/31/1925 – 9/30/2019.
[ii] Source: FactSet, as of 9/1/2020. S&P 500 total return, 3/9/2009 – 8/31/2009 and 3/23/2020 – 8/31/2020.
[iii] Ibid. S&P 500 total return, 8/31/2009 – 9/30/2009.
[iv] Source: FactSet, as of 7/29/2020. S&P 500 price return in election year first halves from 1932 – 2016 and S&P 500 price return, 12/31/2019 – 6/30/2020.
If you would like to contact the editors responsible for this article, please message MarketMinder directly.
*The content contained in this article represents only the opinions and viewpoints of the Fisher Investments editorial staff.
Get a weekly roundup of our market insights
Sign up for our weekly e-mail newsletter.

You Imagine Your Future. We Help You Get There.
Are you ready to start your journey to a better financial future?

Where Might the Market Go Next?
Confidently tackle the market’s ups and downs with independent research and analysis that tells you where we think stocks are headed—and why.
Related Resources
-
Market Analysis On the Iran Flare Up2026-07-08
-
Expert Commentary 3 Things You Need to Know This Week | Midterm Miracle, US Jobs, Tax Planning
 2026-07-07
 -
Weekly Wrap-Up Fisher Investments Reviews: Last Week in Markets—June 29 - July 32026-07-07
-
Market Analysis Can Germany Engineer Faster Growth at Last?2026-07-07


Learn More
Learn why 210,000 clients trust us to manage their money and how Fisher Investments and its affiliates may be able to help you achieve your financial goals.
As of 6/30/2026
New to Fisher? Call Us.
Contact Us Today