Personal Wealth Management / Economics
Tapped-Out Britain?
The UK economy isn't overstretched, built on sand or any other similar cliché.

Ordinarily, an upward revision to GDP growth would bring a bit of good cheer-usually of the "hey, that was better than we thought!" variety. But when UK Q4 GDP growth was revised up to 0.6% q/q on Thursday, it brought some hyperbolic handwringing. Some said it was the wrong kind of growth, built on consumer spending instead of trade and business investment-or, if you will, "sand." Others skipped over the upward bump entirely, latching onto the record-low saving ratio and peacetime record-high current account deficit as evidence the country is stretched beyond its means and facing an ugly day of reckoning. At face value, it all sounds quite scary, but in reality, these stats aren't very meaningful-arbitrary measurements that don't much reflect the country's health. The UK's economy-and by extension, markets-remain in much better shape than most give them credit for.
Let's start with the GDP report. Consumer-driven growth isn't new or necessarily bad. The UK economy is 80% services, after all, so it stands to reason that consumers would do most of the heavy lifting. It's a sore spot for those biased in favor of a manufacturing-heavy economy, nostalgic for the UK's days as an industrial powerhouse, but the country has evolved. All advanced economies have-it is the natural order of things. Agriculture gives way to factories. Factories give way to services. One day services will give way to something else. Maybe intergalactic services! Or intergalactic mining! But it is something to cheer, not fear. Services are no less sustainable as a growth engine than manufacturing. They are just different.
As for the actual expenditure breakdown, we're never ones to write off a drop in business investment, as plunging business investment typically accompanies a recession. But not every drop in business investment brings recession. All Scotch is whiskey, but not all whiskey is Scotch, as it were. Business investment is a fairly volatility data point, and there are plenty of false signals. This expansion has seen several (Exhibit 1). The latest drop stemmed largely from a -9.3% drop in transport equipment investment, which reeks of North Sea oil cutbacks. That is hardly a surprise, as the industry's battle with dirt-cheap oil prices is widely known. Oil-related cutbacks also flipped US business investment negative in Q4. Seems to us this is just another example of Energy's woes masking strength in other sectors.
Exhibit 1: UK Business Investment During This Expansion
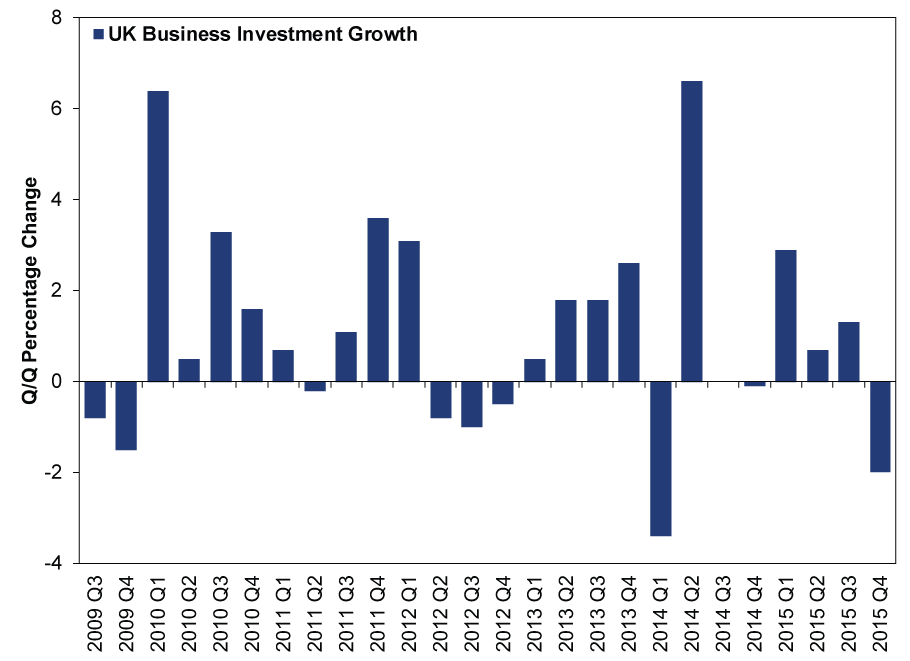
Source: Office for National Statistics, as of 4/1/2016.
Energy also bears much of the blame for that record-high current account deficit. For those not familiar (and we don't blame you), the current account deficit is calculated thusly:
(Exports + Income on Outbound Foreign Direct Investment) - (Imports + Income on Inbound Foreign Direct Investment )
Or if equations aren't your thing, it adds the value of all exports and income on Brits' foreign investments, then subtracts the value of all imports and the income on foreigners' investments in the UK.
The UK typically runs a trade deficit, importing more than it exports. This is fairly normal for advanced, service-driven economies, and it isn't a bad thing. The UK simply takes advantage of other countries' expertise, letting them make trinkets, gadgets and garments while Brits do other things. The world works pretty darned well when countries are allowed to specialize. While other countries make a lot of things, the UK produces services (and still some goods) that require more advanced human capital and, in turn, generate higher incomes and better living standards. So this part of the current account isn't so bad. Nor is the other part, the investment-related stuff. It is tied mostly to falling earnings on Brits' overseas investments, which are in turn tied to the commodities downturn. The UK is home to some of the world's largest Energy and Materials firms, and they have invested a lot in foreign mines and oil fields. These investments have cratered due to falling oil and metals prices. Meanwhile, UK assets have generated nice returns-a sign of the country's strength, yet it subtracts from the current account. Lesson: Sometimes econometrics are weird.
Exhibit 2: The UK's Current Account
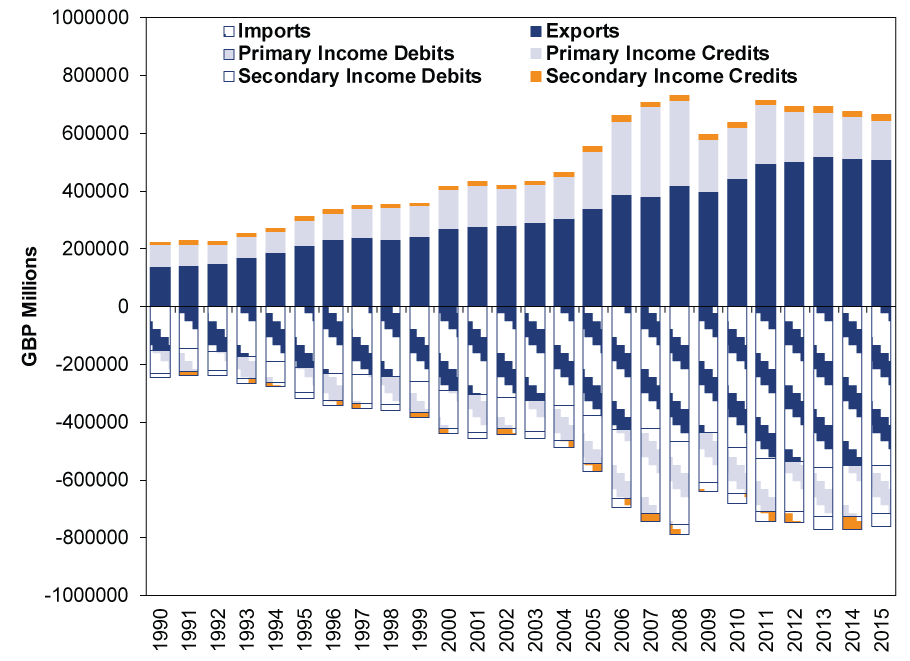
Source: Office for National Statistics, as of 4/1/2016. Page 33 of this report defines all the jargon in detail. But in general, income credits are income earned from abroad, and income debits are income sent abroad. Primary refers to the private sector, and secondary refers to central governments. We presume exports and imports are self-explanatory.
Those who warn of current account doom claim a high current account deficit makes the UK dependent on the kindness of strangers to fund investment (and, most importantly, buy gilts), presuming the negative balance means money is seeping out of the country. But this isn't how it works. There is no seepage. Brits buy things from abroad, and the sellers invest the capital in Britain. This is how foreign trade works. UK debt's attractiveness has nothing to do with trade flows, the current account or, despite the many claims otherwise, EU membership. People, banks, pension funds, central governments and other investors buy gilts because they are liquid, high quality, higher-yielding than many similar assets, and backed by the full faith and credit of Her Majesty's Treasury. They will probably still do this no matter how much the country imports and no matter how much earnings on those foreign commodity investments fall. Gilts are that desirable.
Finally, the household saving ratio, which hit an all-time-low 3.8% in Q4 2015. According to the Office for National Statistics, this means UK households saved a record-low percentage of their disposable income. But here, too, things get wonky, as the ratio has some odd inputs. For one, it doesn't measure households' activities only. UK "household" statistics also include non-profit institutions. So, it's really the purported savings of households, charities, schools and their ilk. Households comprise the bulk of it, but skew is skew. Two, the measure of spending includes an arcane item called owner-imputed rent, which is the amount a homeowner would pay to rent their own home. This...is not a thing anyone actually pays. And yes, mortgage payments are included in expenditures, so this is double-counting and then some. Finally, on the savings side, while it does include pension contributions, it excludes capital gains. That is kind of a big deal. Sure, capital gains aren't new savings, but they represent growth of existing savings, and a lot of people live off them in retirement. Which is sort of what savings are for.
The saving ratio doesn't tell you whether people are overall better or worse off. In 2014, the saving ratio fell all year, yet household net worth rose 12%. Were people really living beyond their means and storing up trouble? Or is economics maybe just weird sometimes?
As for concerns about real disposable income falling -0.6% q/q in Q4 while consumer spending and debt rose, this isn't evidence consumers are tapped out. Consumer spending and disposable income diverge often (Exhibit 3), and household balance sheets are in overall fine shape. Income growth might vary from quarter, but it is growing quite nicely from year to year. Don't let short-term swings make you myopic.
Exhibit 3: Household Spending and Disposable Income
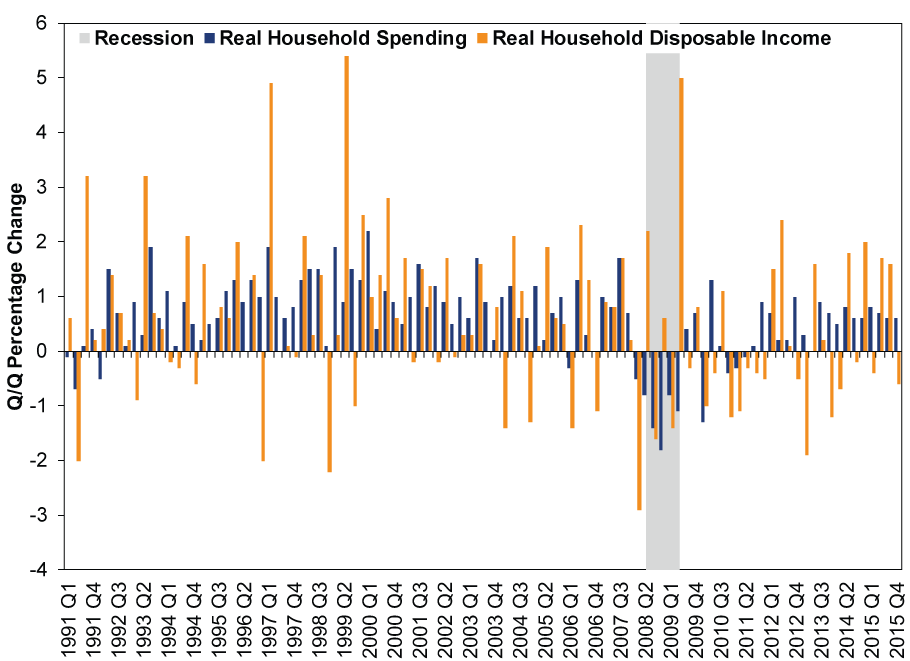
Source: Office for National Statistics, as of 4/1/2016.
Look, we won't argue everything is perfect in the UK economy. No country will fire on all cylinders all the time. But the strong areas outnumber and outweigh the pockets of weakness, and the whole is what ultimately matters. As in the US, the many strong areas are pulling the rest along. With the yield curve steepening a bit lately, the Leading Economic Index in a solid uptrend and money supply growth improving, things should stay good for the foreseeable future.
If you would like to contact the editors responsible for this article, please message MarketMinder directly.
*The content contained in this article represents only the opinions and viewpoints of the Fisher Investments editorial staff.
Get a weekly roundup of our market insights
Sign up for our weekly e-mail newsletter.

You Imagine Your Future. We Help You Get There.
Are you ready to start your journey to a better financial future?

Where Might the Market Go Next?
Confidently tackle the market’s ups and downs with independent research and analysis that tells you where we think stocks are headed—and why.
Related Resources
-
In The News How investors should think about oil and stocks in the Iran war – in 3 simple steps2026-03-23
-
Expert Commentary PMIs, Denmark Snap Election, Tax Season | 3 Things You Need to Know This Week2026-03-23
-
Weekly Wrap-Up Fisher Investments Reviews: Last Week in Markets—March 16 - March 202026-03-23
-
Market Analysis Why “War Winner” Trades Are Off Base2026-03-20


Learn More
Learn why 195,000 clients trust us to manage their money and how Fisher Investments and its affiliates may be able to help you achieve your financial goals.
As of 12/31/2025
New to Fisher? Call Us.
Contact Us Today