Personal Wealth Management / Economics
The Employment Sentiment Trap
Focusing solely on employment data can lead investors astray.

There are plenty of reasons to cheer the US economy's prospects, but unemployment isn't one of them. Photo by Thomas Starke/Bongards/Getty Images.

October's jobs report was another dandy, as payroll gains topped 200,000 again and the unemployment rate ticked down from 5.9% to 5.8%, its post-war (1948) average. We're inclined to spare you the bells and whistles and say, "here's more confirmation the economy grew recently." Headlines, however, claim sunnier labor markets mean the economy is improving and has momentum-reasons to be bullish. Public Service Announcement: Unemployment, a late-lagging indicator, is pretty much never a reason to be bullish or bearish. Assuming it is can lead investors to a dangerous place.
Interested in market analysis for your portfolio? Our latest report looks at key stock market drivers including market, political, and economic factors. Click Here for More!
Since the dawn of economic record keeping, employment has consistently followed growth. Job growth doesn't create economic growth, despite the long-running belief jobs growth drives consumer spending growth drives jobs growth in a virtuous cycle. As we showed a while back, that isn't true. Yet pundits regularly say otherwise. After October's report, one said the data "reinforce what we thought we knew, and can give a bit of solace to anyone who interpreted a burst of financial market volatility last month as a sign that the economy was headed for the rocks." Another said, "'The US is on a roll, the momentum is pretty strong.'" And speaking of momentum, "When read carefully, today's report provides more evidence that the labor market is improving quite rapidly, and that the recovery has gained momentum over the past year."
It does no such thing, as shown in Exhibit 1. Unemployment usually begins falling after an expansion starts and far after a bull market begins. It also tends to peak well after the economy and markets. Pretend you run a small business. Do you hire someone if you just think you might get more business? Probably not! Employees are a commitment and a fixed cost! You don't hire until business is growing and you need more people to help you keep up. You hire because you grew. Similarly, you probably don't start cutting headcount until falling sales makes it impossible for you to keep everyone on hand.
Exhibit 1: Employment-A Late-Lagging Indicator
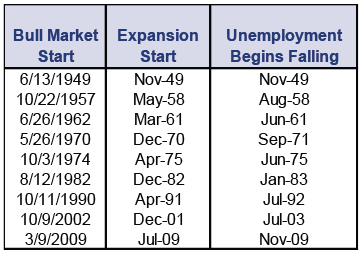
Source: FactSet, as of 11/7/2014. Expansion start dates are defined by the National Bureau of Economic Research (NBER). Bull market start dates are based on S&P 500 Index price level returns. Unemployment is based on the official unemployment rate.
Labor market movement is a delayed reaction to what the economy did months ago. October's jobs report tells you nothing about where the economy grows from here. It simply tells you how hiring managers reacted to growth several months back. It is a very, very late confirmation of what markets already know.
This is the problem with basing investing decisions and market expectations on the unemployment rate or job losses/gains. Markets are forward-looking-they are already well aware of the economic trends this job report confirmed. Basing decisions on such ancient history will not give you an edge. It could also lead to suboptimal timing decisions. As Exhibits 2-6 show, waiting for consistent job losses to confirm a downturn-and consistent job gains to confirm an upturn-can cause you to sell low and buy high. Employment as measured by total nonfarm payrolls (more useful for our purposes than the unemployment rate, which is typically skewed by labor force participation) typically peaks after the market's top and bottoms after the market's low.[i]
Now, you might think "this isn't me!" But let's consider the hypothetical mindset of a smart person caught in what we call the unemployment sentiment trap. Pretend it's early 1973, and stocks are taking it on the chin. Our hypothetical investor is trying to decide what to do, and they look at the unemployment report and see-golly gee whiz-the unemployment rate is falling! All the way from 5.6% in October 1972 to 4.9% in March! Things are surely improving, our friend thinks, so he hangs on. By August, stocks are down 13.3%,[ii] but the unemployment rate is down to 4.8%. Stocks must be wrong, our friend thinks! Unemployment is still fine! The economy is fine! They might not really start feeling the heat until spring 1974, after unemployment climbed back over 5%.[iii] Even though getting out then would mean locking in losses six months before the bottom of a 21-month bear market.[iv] And then, when to get back in? Knowing the mentality at hand, probably not until labor markets improved significantly, showing things were really cooking. But that wouldn't have happened until 1976, 20 months and 60.9% into a new bull market.[v]
We'll concede the above might be a bit extreme-it's just an illustration for dramatic effect. But the trap is real. Whether looking at the unemployment rate or total payrolls, investors who are bullish for the wrong reasons often end up sliding down the proverbial "slope of hope"-constantly saying "it isn't so bad! Things will get better! It's just a flesh wound!" as bear markets slip on down. This is the opposite of the proverbial wall of worry, when investors don't think reality is as good as it really is. It is also the inverse of what we see during corrections, when sentiment gets hammered as stocks fall fast. Bear markets usually start slowly, with long rolling tops that lull folks into complacency. Slow market declines plus improving unemployment is a prime recipe for complacency-unless you start disciplining yourself now.
None of this means you should be bearish today. The economy is growing! But our bullishness comes from leading indicators that suggest expectations for sluggish global growth remain overwrought (among other factors). Not because economic growth several months ago made unemployment look pretty in October.
Exhibit 2: S&P 500 Price Level Index and Total Nonfarm Payrolls (1950s)
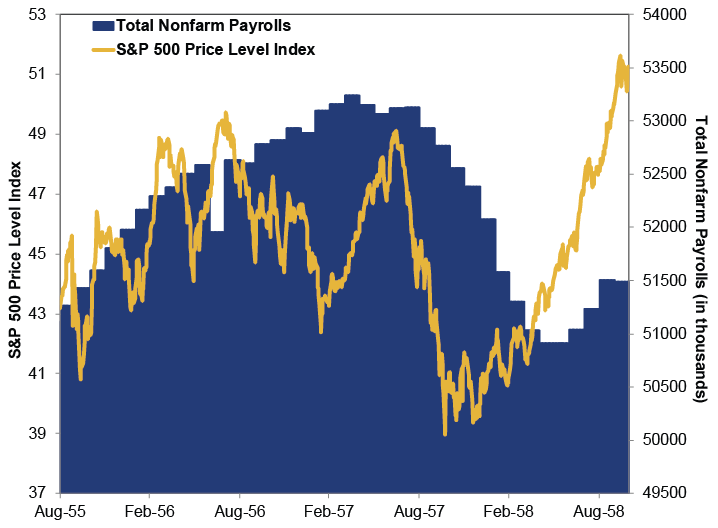
Source: FactSet, as of 11/10/2014. Daily S&P 500 Index price level returns and total nonfarm payrolls, 8/31/1955 - 10/30/1958.
Exhibit 3: S&P 500 Price Level Index and Total Nonfarm Payrolls (1970s)
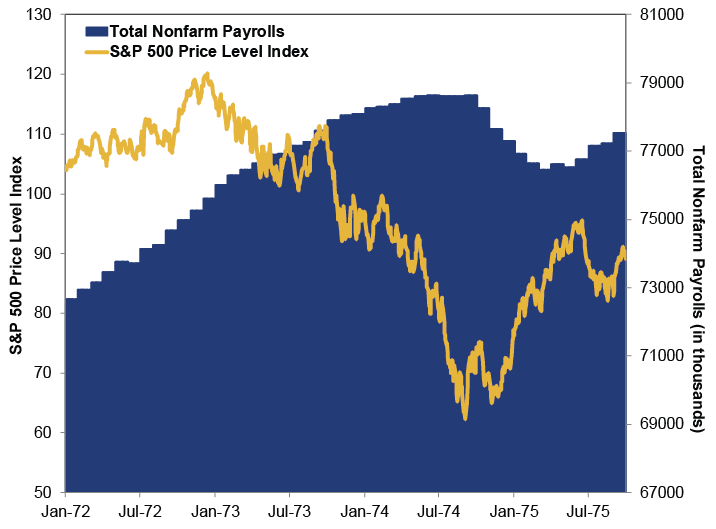
Source: FactSet, as of 11/10/2014. Daily S&P 500 Index price level returns and total nonfarm payrolls, 1/31/1972 - 10/31/1975.
Exhibit 4: S&P 500 Price Level Index and Total Nonfarm Payrolls (Late 1970s - Early 1980s)
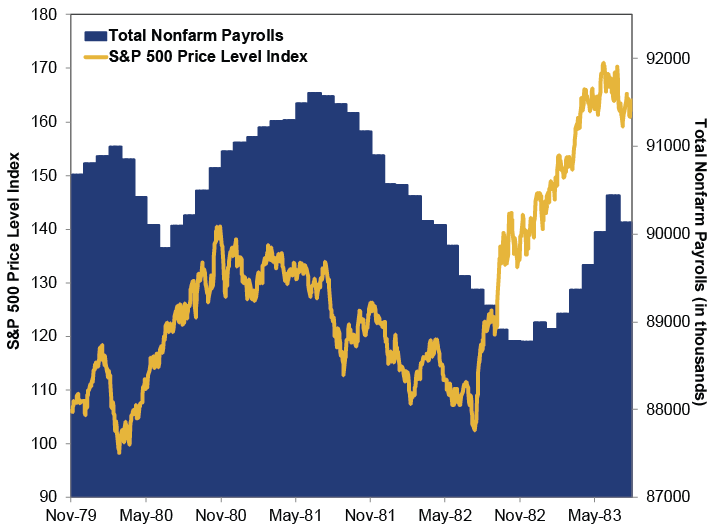
Source: FactSet, as of 11/10/2014. Daily S&P 500 Index price level returns and total nonfarm payrolls, 11/30/1979 - 8/31/1983.
Exhibit 5: S&P 500 Price Level Index and Total Nonfarm Payrolls (Late 1990s - Early 2000s)
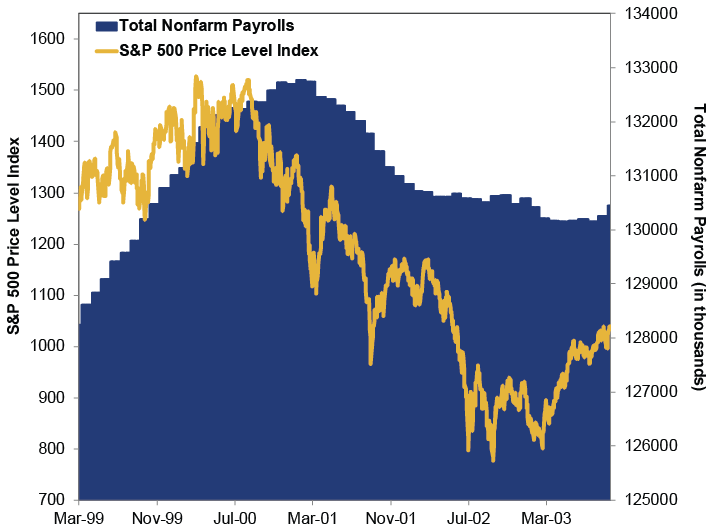
Source: FactSet, as of 11/10/2014. Daily S&P 500 Index price level returns and total nonfarm payrolls, 3/24/1999 - 10/9/2003.
Exhibit 6: S&P 500 Price Level Index and Total Nonfarm Payrolls (Current Market Cycle)
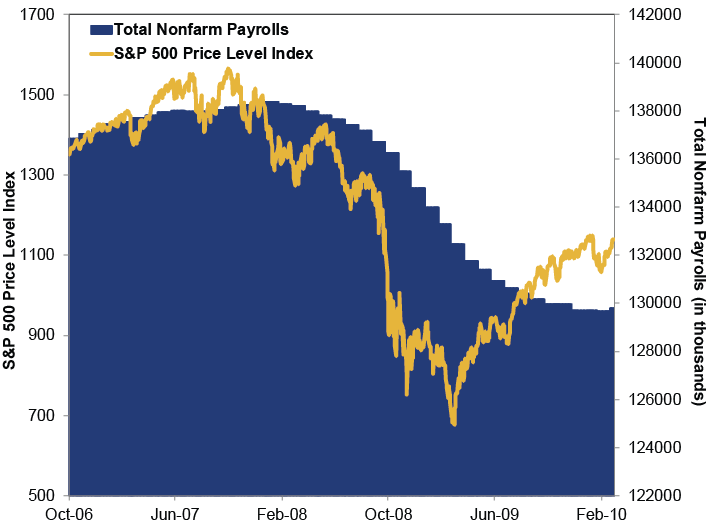
Source: FactSet, as of 11/10/2014. Daily S&P 500 Index price level returns and total nonfarm payrolls, 10/9/2006 - 3/9/2010.
Stock Market Outlook
Like what you read? Interested in market analysis for your portfolio? Why not download our in-depth analysis of current investing conditions and our forecast for the period ahead. Our latest report looks at key stock market drivers including market, political, and economic factors. Click Here for More!
[i]Sometimes payrolls peak prior to the unemployment rate hitting its low and sometimes after-measuring all this is an art rather than a science.
[ii] S&P 500 Index price level returns, 1/11/1973 - 8/31/1973.
[iii] The unemployment rate hit 5.1% March 1974.
[iv]Bear market is based on S&P 500 Index price level returns, 1/11/1973 - 10/3/1974.
[v] S&P 500 Index price level returns, 10/3/1974 - 5/31/1976.
If you would like to contact the editors responsible for this article, please message MarketMinder directly.
*The content contained in this article represents only the opinions and viewpoints of the Fisher Investments editorial staff.
Get a weekly roundup of our market insights
Sign up for our weekly e-mail newsletter.

You Imagine Your Future. We Help You Get There.
Are you ready to start your journey to a better financial future?

Where Might the Market Go Next?
Confidently tackle the market’s ups and downs with independent research and analysis that tells you where we think stocks are headed—and why.
Related Resources
-
Weekly Wrap-Up Fisher Investments Reviews: Last Week in Markets—May 11 - May 152026-05-18
-
Behavioral Finance Investing Lessons From the Indianapolis Motor Speedway2026-05-18
-
Expert Commentary 3 Things You Need to Know This Week | Global Inflation, Fed Minutes, US Sentiment2026-05-18
-
In The News Around the World in Tax Policy Talk2026-05-15


Learn More
Learn why 200,000 clients trust us to manage their money and how Fisher Investments and its affiliates may be able to help you achieve your financial goals.
As of 3/31/2026
New to Fisher? Call Us.
Contact Us Today