Personal Wealth Management / Economics
The Eurozone Economy Needs a Better Publicist
Comparing reactions to US, UK and eurozone growth shows sentiment towards Europe still lags.

Listen up, data fans! Q1 GDP for three of the world's biggest economic players is out. From worst to first, the US grew 0.7% annualized, the UK 1.2% and the eurozone 1.8%.[i] By rights, it seems investors should cheer each in proportion to how much each country or region, you know ... grew. But perceptions are fickle, and the UK received the least cheer. The eurozone garnered relatively more optimism, but no "fastest growing, woohoo" accolades. In America, pundits surely noticed the slowdown, but most headlines were happy to brush it off as a seasonal quirk. This is only the latest sign sentiment is sunnier toward US stocks than non-US, giving the latter a bigger wall of worry to climb. As reality overseas continues beating expectations, non-US stocks should do quite well.
Last week, Fisher Investments founder Ken Fisher held a fun Twitter poll, asking followers how many times the US grew faster than the UK and eurozone during the last 16 quarters. Over half of respondents said the US grew fastest at least 12 of 16 quarters. U-S-A! U-S-A! But the right answer, which received only 25% of the vote, was seven. Yes, in the last 16 quarters through Q1, the US was tops less than half the time.
Why the split between perception and reality? We can hazard a guess: Investors are inadvertently failing to compare like with like. The UK, eurozone and many other nations report quarter-over-quarter GDP growth-tally up all output in Q1, and calculate the percentage difference between that and Q4's total output. (They also report year-over-year growth-the percentage difference between output in Q1 2017 and Q1 2016's total.) But the US, Japan and a couple others report annualized GDP: tally up all Q1's output, do a bunch of seasonal adjustments and then multiply by four to show what full-year GDP would be if that pace held.[ii] The percentage change between Q1 2017's seasonally adjusted annualized GDP and Q4's is the seasonally adjusted annualized growth rate.
Media coverage logically uses the numbers provided by national statistics outfits, so most UK GDP write-ups discussed Q1's 0.3% q/q growth instead of the 1.2% annualized figure, while eurozone coverage centered on the bloc's 0.5% q/q growth. As a result, the casual, non-econo-nerd reader may exaggerate the US economy's relative strength, creating the impression of consistently inferior foreign growth. Here is what people see, in effect:
Exhibit 1. Annualized GDP Changes Dwarf Quarterly
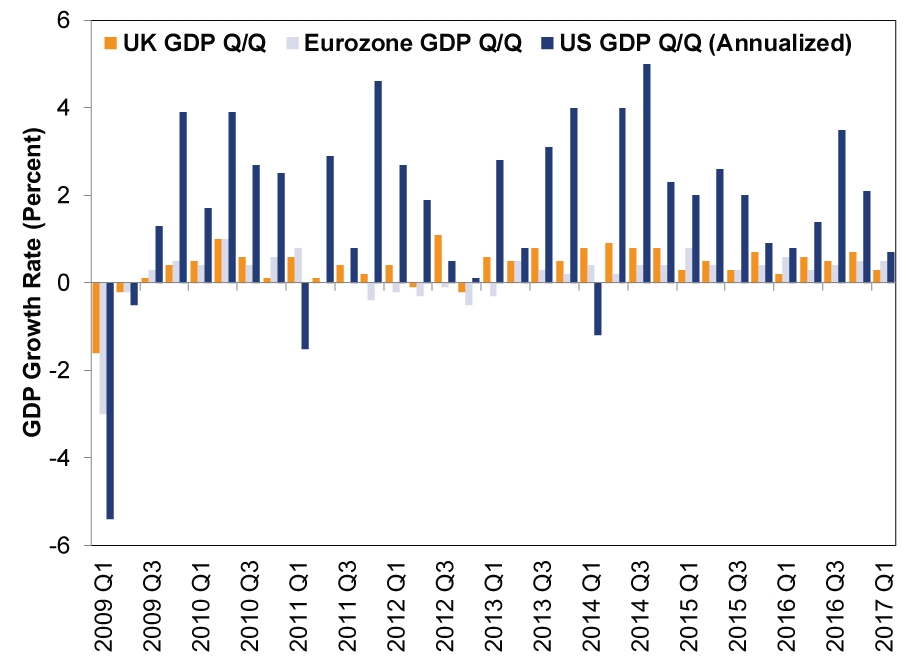
Sources: Office for National Statistics, Eurostat and the Bureau of Economic Analysis, all as of 5/4/2017. Q1 2009 - Q1 2017.
However, using apples-to-apples annualized numbers for all three shows frequent ranking shifts, particularly in recent quarters-and no one surpassing the rest by a country mile.
Exhibit 2: Not So Different After All

Source: FactSet, as of 5/3/2017. Annualized US, UK and eurozone GDP growth rates, Q2 2013 - Q1 2017.
Recent history also influences coverage on both sides of the Atlantic. Europe endured 2008's global crisis, but then suffered a regional bear market and recession in 2011 - 2013, as the sovereign debt crisis triggered fears the currency union would splinter. Nearly a half-decade on, the "fragile Europe" meme persists: Headlines still fret eurozone debt troubles and populist threats to the currency bloc. Tellingly, the word "recovery" still dominates headlines about eurozone growth, even though the term hasn't been technically accurate since 2015 (when GDP surpassed its pre-crisis peak).
Likewise, UK headlines are still dominated by Brexit, plus occasional warnings of a guaranteed recession and mass investment exodus. Obviously there has been no recession or exodus, or exit for that matter. The UK is still in the EU, and minimum two-year long negotiations (with both sides incented to maintain trade ties) are only just beginning. But the media's take on mostly positive data since the vote has been cautious to say the least. Stories about Q1 GDP latched onto subpar services growth-up just 0.3% q/q-as evidence the weak pound and rising inflation are slamming consumers at last, perhaps presaging a downturn. As we've written, inflation and softer sterling aren't really negatives for the UK economy (or wholly caused by the Brexit vote), but they provide fodder for worries today.
Contrast the UK and Europe's experience with the US: one painful recession followed by eight years of bull market, which has beaten abundant false fears into submission. Hints of strength (though frequently misperceived or backward-looking) are everywhere: The Fed is "normalizing" monetary policy, hiking interest rates and mulling over trimming its balance sheet, and the economy is basically at full employment.[iii] Hence, more investors and pundits tout US expansion. While the eurozone is only now starting to think about shaking its post-crisis mentality, America did the same a few years ago.
This divergent outlook raises the odds of eurozone outperformance in 2017. Markets move on the gap between reality and expectations, and Europe's bright and improving reality easily surpasses prevailing worries. 16 straight quarters of GDP growth is a lot! It's broad-based, too: In 2015 and 2016's 8 quarters, an average of 2 of 19 eurozone members contracted.[iv] This sustained growth has caught many unawares: Citigroup's Europe Economic Surprise Index-which measures how professional expectations compare with economic data-matches recent highs, while the US version dipped into negative territory last month. US data are still largely fine, mind you, but expectations are higher. The eurozone has an easier hurdle to clear-and with political uncertainty falling post-French election (and forward-looking indicators pointing positively), the region looks poised to surprise further, benefiting investors with global exposure.
[i] Source: FactSet, as of 5/9/2017.
[ii] You might notice the eurozone's 0.5% q/q growth multiplied by four should equal 2.0% and wonder why we cited it as 1.8%. The difference is rounding. Annualizing is done before growth rates are rounded off to one decimal. Here is the actual math in case you, like our middle school teachers, want us to show the work: Q4 2016 eurozone GDP (millions of euro, seasonally and calendar adjusted) was €2,531,236.1. Q1 2017 was €2,542,753.8. That equates to 0.455% q/q growth-which rounds to 0.5%. Yet 0.455% multiplied by four equals 1.82%, which rounds to 1.8%. (Our source for these figures is Eurostat.)
[iii] We prefer the Conference Board's US Leading Economic Index (LEI) to these metrics, as it offers a glimpse into future business conditions. In its more than half-century lifespan, no recession has begun while the LEI was high and rising, as it is today.
[iv] Source: Eurostat, as of 5/9/2017. Calculated using annualized growth rates.
If you would like to contact the editors responsible for this article, please message MarketMinder directly.
*The content contained in this article represents only the opinions and viewpoints of the Fisher Investments editorial staff.
Get a weekly roundup of our market insights
Sign up for our weekly e-mail newsletter.

You Imagine Your Future. We Help You Get There.
Are you ready to start your journey to a better financial future?

Where Might the Market Go Next?
Confidently tackle the market’s ups and downs with independent research and analysis that tells you where we think stocks are headed—and why.
Related Resources
-
Expert Commentary This Week in Review | Q2 Market Recap, June US Jobs, Trade Deal Update
 2026-07-03
 -
Market Analysis Why El Niño Doesn’t Necessitate Portfolio Shifts2026-07-01
-
Market Analysis Declaring Fed Independence Fears False2026-07-01
-
Market Analysis Reader Mailbag: June 20262026-06-30


Learn More
Learn why 200,000 clients trust us to manage their money and how Fisher Investments and its affiliates may be able to help you achieve your financial goals.
As of 3/31/2026
New to Fisher? Call Us.
Contact Us Today