Personal Wealth Management / 2020 Election
The Persistent Partisan Divide in Consumers’ Economic Expectations
The University of Michigan’s Survey of Consumers continues showing partisan bias infects respondents’ economic expectations—an error investors should try hard to avoid.

Editors’ Note: MarketMinder is intentionally non-partisan. We favor neither party nor any candidate and consider political bias blinding and a frequent source of investment error.
Wednesday morning, The University of Michigan released its November US Survey of Consumers—an index compiling responses to various underlying questions in an effort to gauge how people feel about current and expected economic conditions. Now, we don’t think this gauge tells you much about what consumers will do in the period ahead. There is little to no sign it predicts spending behavior. But there are some ways this is useful for investors. One we think is relevant right now: It serves as a stark reminder not to let partisan political views infect your economic or stock market outlook.
We base the preceding statement on a series of survey questions that assess consumers’ feelings about current and future economic conditions based on their political leanings (Republican, Democrat or Independent[i]). UMich hasn’t always done so—the history of this survey question is spotty until mid-2016. Even then, researchers didn’t ask monthly until February 2017. Still, we think the findings are telling: Many people base their economic expectations on whether the party they favor holds the presidency, as Exhibit 1 clearly shows.
Exhibit 1: Consumer Expectations for Economic Conditions
Source: FactSet, as of 12/2/2020. University of Michigan Consumer Expectations by Political Party, June 2016 – November 2020. Dashed lines indicate that the question wasn’t asked to survey respondents from November 2016 – January 2017.
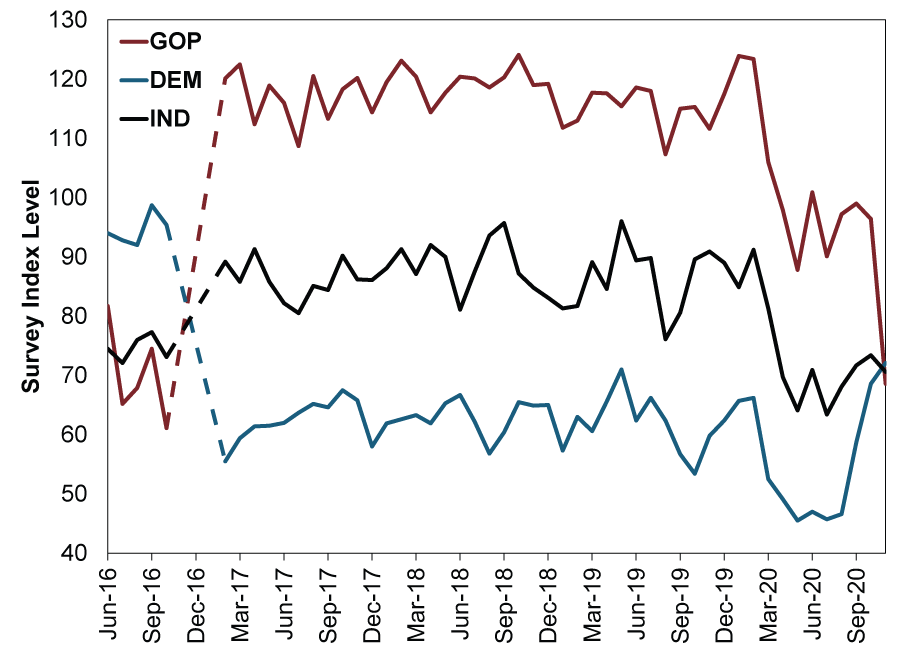
As you can see, economic expectations among Republican respondents plunged after last month’s election, while Democratic respondents became much sunnier. This is the exact opposite of the pattern following 2016’s election. Clearly, these elections’ outcomes impacted how many respondents felt about the economic future. This partisan divide was deeply entrenched—even persisting throughout 2020’s economic tumult.
But there is little evidence that elections should color your feelings about the economy to this degree. Yes, policy shifts can have effects. But they are rarely large enough to affect macroeconomic trends. Consider: In the final 12 quarters of Barack Obama’s presidency, GDP growth averaged 2.38% annualized. In the 12 quarters of Donald Trump’s presidency that preceded 2020’s COVID lockdowns, it averaged 2.51%.[ii] That is not a huge difference—it doesn’t seem to justify the sentiment swing UMich’s survey found.
Now, of course, if we included 2020’s three reported quarters in Trump’s average, it would fall—to 1.79%. Similarly, the Obama average would fall to 1.96% annualized if we dated it from the beginning of his time in office.[iii] But both these periods include recessions that seem largely removed from presidential politics: 2008’s financial crisis preceded the election by a long, long way—and, in our view, was tied to an apolitical accounting rule change. 2020’s pandemic lockdowns were fully global—and, in America, determined principally at the state and local levels.
Therein lies the point: Political considerations can and do matter for stocks and the economy. But beware of presuming that one party or candidate is make or break for growth ahead. You must weigh economic factors that extend far beyond the White House. Even when you do weigh politics, we think you must consider not only the color of the party in charge, but their ability to legislate. Furthermore, while legislation and regulation can matter, it is important to scale that to consider the economic effect (for good or ill)—and weigh it against sentiment.
In our view, the tale Michigan’s survey tells over the past four-plus years is that many respondents’ economic views flip much more radically than they should with changes in party control of the White House. That is a reminder to investors, in our view, not to let party views dictate portfolio positioning.
[i] Maybe they found all three independents? That is a joke, of course, there are more. Too soon?
[ii] Source: US Bureau of Economic Analysis, as of 12/2/2020. Simple average quarterly growth rate, Q1 2014 – Q4 2016 and Q1 2017 – Q4 2019.
[iii] Ibid. Simple average quarterly growth rate, Q1 2009 – Q4 2016 and Q1 2017 – Q3 2020.
If you would like to contact the editors responsible for this article, please message MarketMinder directly.
*The content contained in this article represents only the opinions and viewpoints of the Fisher Investments editorial staff.
Get a weekly roundup of our market insights
Sign up for our weekly e-mail newsletter.

You Imagine Your Future. We Help You Get There.
Are you ready to start your journey to a better financial future?

Where Might the Market Go Next?
Confidently tackle the market’s ups and downs with independent research and analysis that tells you where we think stocks are headed—and why.
Related Resources
-
Expert Commentary 3 Things You Need to Know This Week | Midterm Miracle, US Jobs, Tax Planning
 2026-07-07
 -
Weekly Wrap-Up Fisher Investments Reviews: Last Week in Markets—June 29 - July 32026-07-07
-
Market Analysis Can Germany Engineer Faster Growth at Last?2026-07-07
-
Expert Commentary This Week in Review | Q2 Market Recap, June US Jobs, Trade Deal Update
 2026-07-03


Learn More
Learn why 210,000 clients trust us to manage their money and how Fisher Investments and its affiliates may be able to help you achieve your financial goals.
As of 6/30/2026
New to Fisher? Call Us.
Contact Us Today