Personal Wealth Management / Market Analysis
The Rational Disconnect Between Stocks and the Economy
It is normal for stocks and economic data to deviate as a new cycle begins.

With the S&P 500 up 43% from its March 23 year-to-date low and closing in on its prior peak, one theme seems to be dominating financial commentary this week: the apparent disconnect between soaring stocks and plunging economic data.[i] Some of it struck us as rational, pointing out that it is normal for stocks to appear cold in the face of civil unrest and improve before the economy does. But the vast majority of it presumed the market must be incorrect, driven by too-high hopes and Fed policy, with a reversion in store once investors come to grips with just how bad things are. We acknowledge the possibility, but we also think it is worth pointing out that this is how bull markets normally begin. Stocks are a leading indicator. They move on the gap between expectations and reality over the next 3 – 30 months or so, not the next 3 – 30 days. To show this, we thought it would help to take a trip down memory lane to see what things looked like in the weeks and months after March 9, 2009, the day the last bear market reached its ultimate low and a new bull market began.
Let us start with the headlines, which looked an awful lot like they do today. Here is just a smattering, starting with one of the biggest stories on the day stocks bottomed out:
- Warren Buffett to CNBC: Economy Has ‘Fallen Off a Cliff’ (CNBC.com, 3/9/2009)
- Dow 5000? There’s a Case for It (The Wall Street Journal, 3/9/2009. Note: the Dow was just over 6600 when this was published, according to FactSet.)
- How Low Can the Stock Markets Go? (Forbes, 3/11/2009)
- It May Be Time for the Fed to Go Negative (The New York Times, 4/18/2009)
- Flashbacks of the 1970s for Stock Market Vets (The Wall Street Journal, 4/18/2009)
- Global Economy Called Worst Since 1945 (The New York Times, 4/22/2009)
- Economy Shrinks at Fastest Rate Since 1950s (The New York Times, 4/29/2009)
- Stop Thinking the 30% Stock Market Rally Means the Bear Market Is Over (Business Insider, 5/1/2009)
- What Happens to the American Dream in a Recession? (The New York Times, 5/7/2009)
- On Wall Street: Beware of the Sucker’s Rally (Financial Times, 5/8/2009)
- Long-Term Investing Doesn’t Work (The Motley Fool, 6/5/2009)
- Will Overstimulating Economy Bring Inflation? (NPR, 6/29/2009)
- Sorry, Stocks Still Aren’t Cheap (Business Insider, 7/8/20009)
- The Economy Is Even Worse Than You Think (The Wall Street Journal, 7/14/2009)
There are many, many more where those came from, but you get the drift.
We aren’t picking on the headline writers who came up with these or the actual reports themselves. Some of them were flat-out accurate for the conditions they were seeing at the very moment they were written. To anyone taking even a cursory glance at economic data and corporate earnings releases during this stretch, stocks probably did indeed look insanely disconnected from the facts on the ground. Exhibits 1 – 3 show the S&P 500 Price Index alongside earnings, GDP and major monthly economic data in 2009. As you look at them, bear in mind that the relevant data reports came out weeks after the period in question ended, making stocks look even more out of touch than the charts would suggest.
Exhibit 1: Stocks and Earnings Growth in 2009
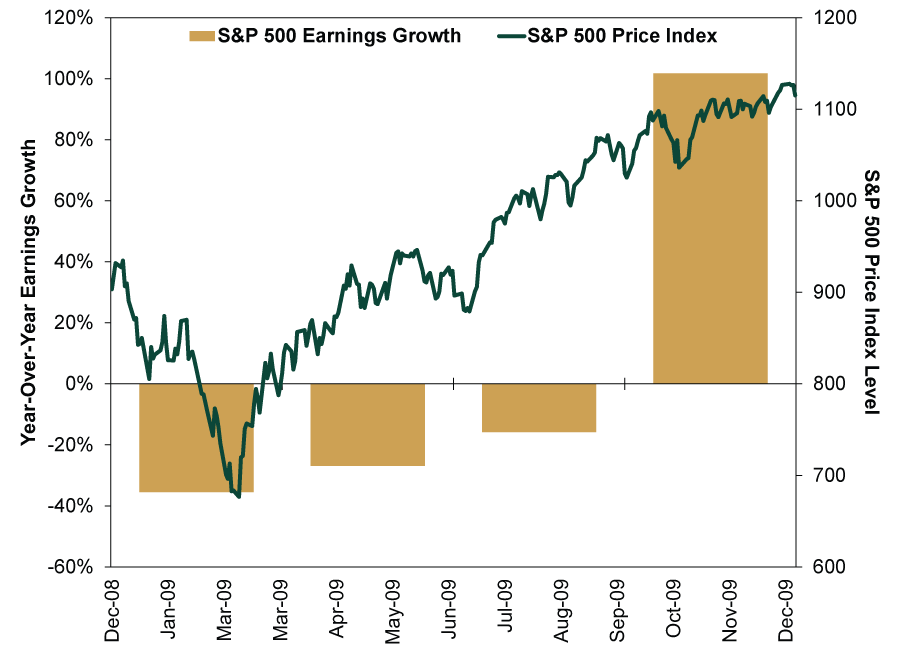
Source: FactSet, as of 6/9/2020. S&P 500 Price Index level, 12/31/2008 – 12/31/2009, and S&P 500 earnings growth, year-over-year, Q1 2009 – Q4 2009.
Exhibit 2: Stocks and Monthly Economic Data in 2009
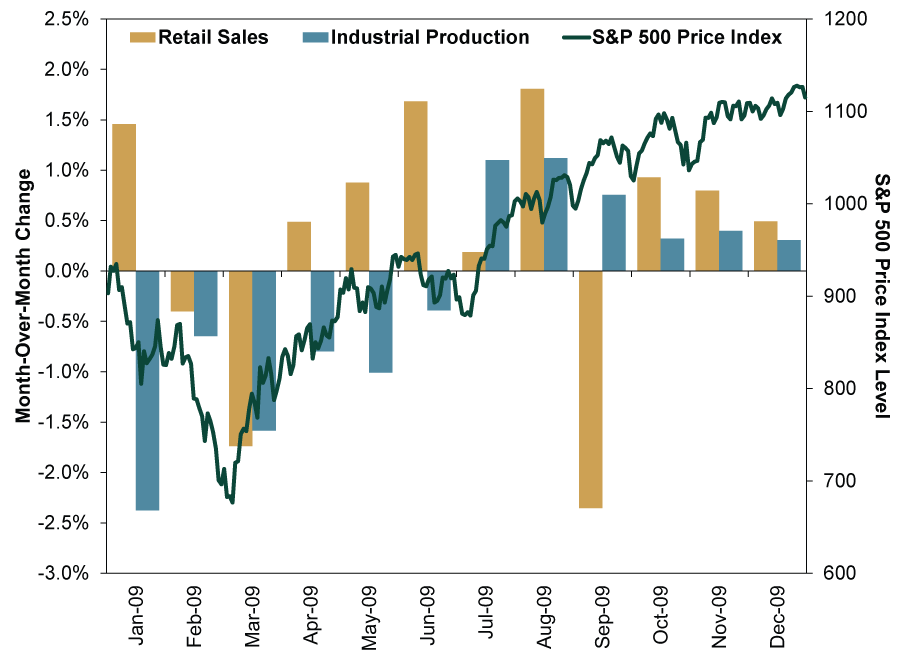
Source: FactSet, as of 6/9/2020. S&P 500 Price Index level, 12/31/2008 – 12/31/2009, and Retail Sales and Industrial Production growth, month-over-month, January 2009 – December 2009.
Exhibit 3: Stocks and GDP Growth in 2009
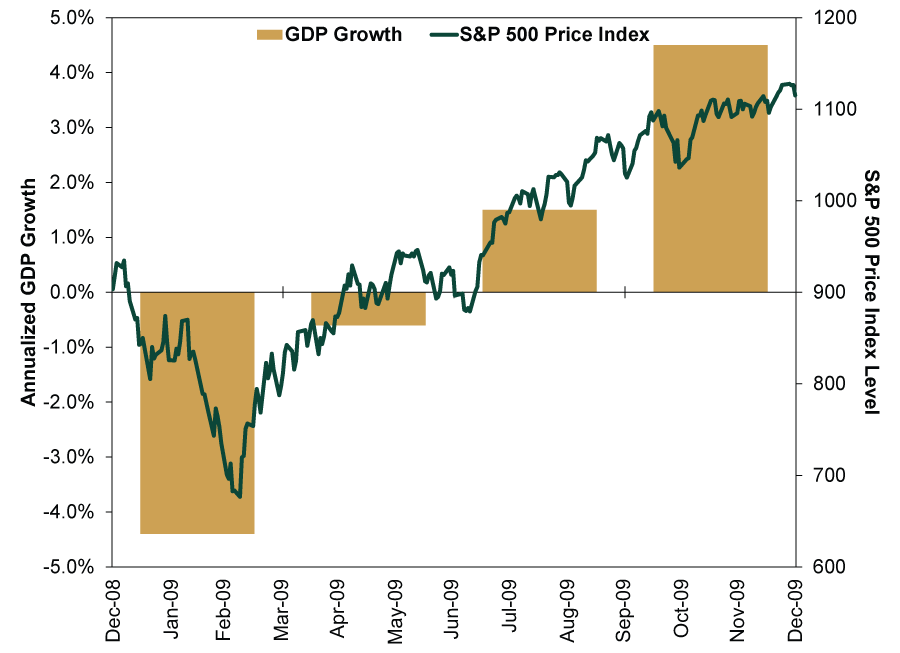
Source: FactSet, as of 6/9/2020. S&P 500 Price Index level, 12/31/2008 – 12/31/2009, and US GDP growth, seasonally adjusted annualized rate, Q1 2009 – Q4 2009.
The issue here is that most headlines and economic data are either a reflection of now, or the recent past. Yet markets look forward. They discount expectations, opinions and headlines. Early on, negativity becomes the basic bricks in the new bull market’s wall of worry. In 2009, it would be months before some pundits’ pessimistic disbelief in the rally gave way to a begrudging half-acceptance. For others it took years, with stocks climbing higher in fits and starts as negative headlines poured in.
So yes, there is a disconnect between economic data and stocks. But it doesn’t mean markets are irrational or pumped up by stimulus or have ceased to function in their normal role. It means they are doing what they have always done: Anticipating future conditions after weighing the worries that headlines and data convey. You should expect that to continue for a long time from here, regardless of where markets head in the near term.
If you would like to contact the editors responsible for this article, please message MarketMinder directly.
*The content contained in this article represents only the opinions and viewpoints of the Fisher Investments editorial staff.
Get a weekly roundup of our market insights
Sign up for our weekly e-mail newsletter.

You Imagine Your Future. We Help You Get There.
Are you ready to start your journey to a better financial future?

Where Might the Market Go Next?
Confidently tackle the market’s ups and downs with independent research and analysis that tells you where we think stocks are headed—and why.
Related Resources
-
Expert Commentary This Week in Review | Fed Meeting, US GDP, Eurozone GDP
 2026-07-31
 -
Economics Q2 US GDP’s Stealthy Strength2026-07-31
-
Market Analysis Don’t Fret the EU’s Low Summertime Gas Storage Levels2026-07-31
-
Economics On Fires and GDP2026-07-30


Learn More
Learn why 210,000 clients trust us to manage their money and how Fisher Investments and its affiliates may be able to help you achieve your financial goals.
As of 6/30/2026
New to Fisher? Call Us.
Contact Us Today