Personal Wealth Management /
The Shutdown Shuts Down
In the end, the longest shutdown ever was also the most bullish.

It is over! Thirty-five days after this partial government shutdown began, Congress and the White House shook on a stopgap bill to restore funding for three weeks—just enough time to send out a couple rounds of back paychecks, update government websites’ security certificates, clean up the national parks and, we imagine, update and publish some delayed economic data. Alas, the break from that was fun while it lasted. Oh, and on the political side of things, it gives them three weeks to continue haggling over border security/don’t-call-it-a-wall funding while not depriving civil servants of much-needed income. That means we could very well find ourselves staring down another shutdown in three weeks. But in the meantime, it is worth taking a quick look back at history’s longest government shutdown and what we know so far about its effect on stocks and the US economy.
Presuming this new funding bill does get passed, signed, sealed and delivered, this shutdown won’t just be the longest ever—it will also be the most bullish! The S&P 500’s cumulative 10.3% price return since the government shut is miles above any other shutdown’s return. It makes the 2.4% return during 2013’s government shutdown, which was the biggest until now, look like peanuts.
Exhibit 1: Returns During and After Government Shutdowns
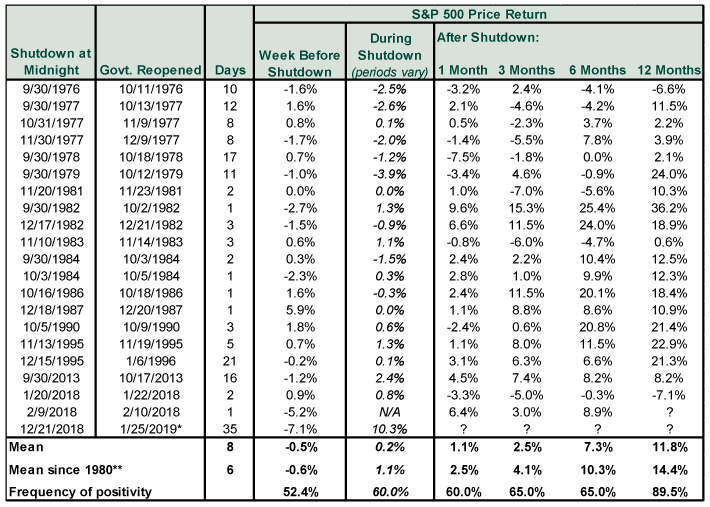
Source: FactSet and Congressional Research Service, as of 1/25/2019. S&P 500 price returns, 9/23/1976 – 1/25/2019. *Date and corresponding returns presume the funding bill is signed on Friday, as the White House alluded. **Prior to the 1980s, shutdowns were less complete, with some agencies staying open on the presumption that Congress didn’t intend for them to close. Since the early 1980s, agencies had to shut down unless they have “some reasonable and articulable connection between the function to be performed and the safety of human life or the protection of property.” This change reflects a reinterpretation of the “Antideficiency Act.”
As for the economic impact, this is next to impossible to pin down. Yes, it is relatively easy to guesstimate the lack of public spending, but that is only part of the total deleted activity. In 2017, nominal GDP was about $19.49 trillion, with federal spending and investment at $1.27 trillion.[i] Three-fourths of government spending was funded during the shutdown, making $317.5 billion’s worth of annual spending unfunded. Back-of-the-envelope math puts that at about $870 million of missed spending daily, multiplied by 35 days of closure, for a grand total of about $30.45 billion, or about 0.16% of annual nominal GDP. But then, we have to add in lost private-sector output, which loosely includes the following:
- All the meals and drinks government employees didn’t buy on their lunch breaks, coffee runs and happy hours while they were furloughed
- Other spending that furloughed government workers may have cut back
- The food and tchotchkes restaurants and shops didn’t sell to people who would have otherwise visited national parks once sanitation concerns began keeping folks away
- Investments that weren’t made because small businesses couldn’t get loans while the Small Business Administration (and its lending program) was shut
- New craft beer that couldn’t get sold because the government agency that approves beer labels was shut (a travesty, if there ever was one)
Some of this commerce will end up merely delayed, not cancelled. Once the Small Business Administration processes that big loan backlog, investment can go forth. If craft breweries need customers’ help burning through held-up inventory, we volunteer as tribute. Once government workers receive back pay, they can move forward with delayed purchases. Those who chose to file for unemployment or get jobs (temporary or permanent) in the private sector may have just kept spending as usual. So it may turn out that a lot of the secondary impact looks like activity getting pulled from early Q1 to late Q1 or early Q2. Even if that doesn’t end up being the case, we are talking about the downstream spending of about 800,000 workers, which is on par with the entire employed population of Idaho. It is also about 0.5% of the total number of US employees.[ii] Five weeks’ worth of delayed spending by half a percent of the working population, plus 0.16% of GDP from lost federal spending, likely isn’t enough to cause a recession in an economy that is otherwise growing.
For investors, the biggest question may be whether the good folks at the Census Bureau can gather and crunch numbers fast enough to get some long-delayed economic data out before the next potential shutdown looms. So far, major missed releases include November trade data and December retail sales, building permits and durable goods orders. Q4 GDP is scheduled to come out on Wednesday, but that may be a stretch. If it does come out, it may come with a warning that it includes more estimates than the initial release usually would. While we are as keen as anyone to get the US economy’s latest score sheet, however, it seems clear stocks haven’t waited for clarity. They have kept right on pricing in activity as it happens, rather than wait for the statisticians to count it. They do that every day, as it happens. It is just more visible when the government isn’t releasing flagship reports.
Overall, we are thankful for an end to the breathless headlines and happy for folks who have been anxious to go back to work—or get paid for work they already performed. And we are thankful that positive returns during a long shutdown have perhaps dispelled, for now, the myth that government shutdowns are big stock market risks. But in general, this is merely the end of an event that didn’t mean a whole lot for the broader market in the first place.If you would like to contact the editors responsible for this article, please message MarketMinder directly.
*The content contained in this article represents only the opinions and viewpoints of the Fisher Investments editorial staff.
Get a weekly roundup of our market insights
Sign up for our weekly e-mail newsletter.

You Imagine Your Future. We Help You Get There.
Are you ready to start your journey to a better financial future?

Where Might the Market Go Next?
Confidently tackle the market’s ups and downs with independent research and analysis that tells you where we think stocks are headed—and why.
Related Resources
-
Market Analysis The New Tariffs in Town Are Still Old News2026-07-24
-
Expert Commentary This Week in Review | Market Volatility, Tariffs, SpaceX
 2026-07-24
 -
Economics A Summertime Check-in on US Consumers2026-07-23
-
Expert Commentary Why Ken Fisher Is Optimistic About European Stocks
 2026-07-23


Learn More
Learn why 210,000 clients trust us to manage their money and how Fisher Investments and its affiliates may be able to help you achieve your financial goals.
As of 6/30/2026
New to Fisher? Call Us.
Contact Us Today