Personal Wealth Management / Economics
The Trade Parade Marched On in 2017
While all eyes were on Davos, new data showed underappreciated trade growth continues to help power the bull market.

This time in 2017, folks fretted a newly inaugurated President Trump would oversee a wave of protectionist policies, potentially sparking a trade war. Today, despite limited action on trade, coverage of Trump’s Davos visit extended those same fears—touting a standoff between the administration’s “America First” approach and a skeptical world. (Media persisted with this angle despite the fact the speech seems to have been well received by the global business community.) In our view, trade war chatter is no more credible than a year ago—and the focus on who is saying what to whom reflects media’s tendency to highlight personality over policy and high-profile rhetoric over (frequently boring) action. Moreover, for all the talk of protectionism and new trade barriers, global trade had another banner year in 2017. In our view, rising global trade set against a backdrop of protectionism fears shows the gap between sentiment and reality is wide—fuel for continued bull market.
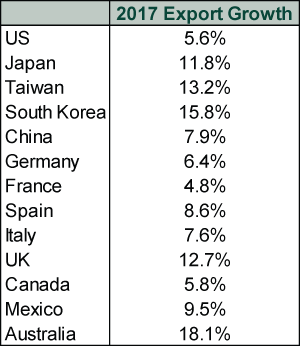
2017 was going to be the year countries turned inward, trading less and focusing instead on boosting or protecting domestic industries. Or at least, that is what the Davos crowd and many investors feared. However, it didn’t happen. An array of country-level data show 2017 exports exceeded 2016 totals.
Exhibit 1: Broad-Based Export Growth in 2017
Sources: US Bureau of Economic Analysis for US; Washington Post for Japan and China; Xinhua for Taiwan; Bloomberg for Korea, Eurostat for Germany, France, Spain and Italy; the Office for National Statistics for the UK; Statistics Canada; Wall Street Journal for Mexico; and the Australia Bureau of Statistics, all as of 1/26/2017. Note: Full December trade data weren’t yet available for the US, Germany, France, Spain, Italy, the UK, Canada and Australia. For these countries, the table shows January – November 2017 exports versus the same period in 2016.
Here are a few highlights from the most recent national monthly reports showing most countries’ exporters closed out 2017 strong.
US: On Friday, the Census Bureau published its early peek at December trade. This advance report—which includes only goods, not services—showed exports rose 2.7% m/m (9.2% y/y). We won’t have December data including services until early February, but the trend is up: Exports of goods and services combined rose 2.3% m/m in November (8.3% y/y), the most since last December and the 8th rise in the last 12 months.
China: Exports grew 10.9% y/y in December, slower than 12.3% in November but largely in line with 2017’s trend. December also marked China’s 10th consecutive month of export growth after mostly falling in 2015 and 2016—another data point belying hard landing fears.
Japan: Export values rose 9.3% y/y in December while volumes climbed 4.6%. The gap indicates the yen’s weakness is still inflating exports’ value, but volumes still grew nicely. December’s figures prolong a recent trend: After struggling in 2015 and 2016, Japanese exports rose consistently last year. With domestic consumption still weak, trade fueled Japanese growth in 2017—a testament to strong global demand.
Taiwan: Export orders grew 17.5% y/y in December, faster than expected and accelerating from November’s 11.6%. This was the gauge’s 17th consecutive year-over-year increase. Taiwan is a key part of the global electronics supply chain, so strong export orders reflect robust demand for tech products.
Soft spots remain, of course. Korean Q4 GDP contracted -0.2% q/q, with exports’ -5.4% q/q decline helping drive the dip. However, this was in part due to a high Q3 base, when exports surged 6.1% q/q, as well as a 10-day autumn holiday that cut the number of working days in the quarter. Temporary skew, not newfound weakness.
Rising global trade isn’t inherently noteworthy—it is a normal feature of most expansions—but it forms part of a sound fundamental backdrop investors don’t seem to quite grasp yet. The gap between sentiment and reality may be greater given recent export growth comes on the heels of a rare mid-expansion global trade downtick in 2015. A recovery started in November 2016, when global merchandise trade rose 2.4% m/m, its biggest monthly jump (and first time breaching 2%) since May 2012.[i] Since then, it has risen in 8 of 12 months (through November), including 3 more 2%+ months. But this good news went largely unnoticed as investors dwelt on Brexit negotiations, eurozone populism, President Trump and other presumed harbingers of protectionism.
Little has changed since global political and business bigwigs last convened in Davos. Now, as at 2017’s start, trade war speculation mostly serves to distract from ongoing global growth and robust actual trade. This suggests to us investors may not fully appreciate the bull’s strength yet—evidence it likely has longer to run.
[i] Source, Netherlands Bureau for Economic Policy Analysis, as of 1/31/2018. https://www.cpb.nl/en/worldtrademonitor
If you would like to contact the editors responsible for this article, please message MarketMinder directly.
*The content contained in this article represents only the opinions and viewpoints of the Fisher Investments editorial staff.
Get a weekly roundup of our market insights
Sign up for our weekly e-mail newsletter.

You Imagine Your Future. We Help You Get There.
Are you ready to start your journey to a better financial future?

Where Might the Market Go Next?
Confidently tackle the market’s ups and downs with independent research and analysis that tells you where we think stocks are headed—and why.
Related Resources
-
Market Analysis The Politics and Practicalities of the Social Security Trust Fund2026-06-16
-
Market Analysis Gold Fails the Safe Haven Test Again2026-06-16
-
Expert Commentary Ken Fisher on Crypto, Inflation, AI Bubble and Annuities
 2026-06-16
 -
Weekly Wrap-Up Fisher Investments Reviews: Last Week in Markets—June 8 - June 122026-06-15


Learn More
Learn why 200,000 clients trust us to manage their money and how Fisher Investments and its affiliates may be able to help you achieve your financial goals.
As of 3/31/2026
New to Fisher? Call Us.
Contact Us Today