Personal Wealth Management / Market Analysis
The Truth About May—It Is a Month
Selling in May is a not a recipe for boosting returns.

It's May 28! Have you sold your stocks and gone away? We hope not, because so far it would have proven pretty darn unnecessary, given global stocks have posted positive returns thus far. Actually, selling in May would pretty routinely prove an unnecessary-even costly-choice. Whatever happens these last few days, evidence abounds confirming that, despite its catchy rhyme, "Sell in May and go away" isn't a useful investment strategy.
The adage has its roots in market history and average returns (uh-oh). In English markets' early days, brokers took the summer off, gallivanting about from May-until the last horse race of the season, the St. Leger Stakes. While they holidayed, trading was thin, markets weren't terribly liquid, and legend has it stocks had the summertime blues. Ergo, "Sell in May and go away, come back at St. Leger Day." Brokers don't take four-month holidays anymore, but the catchphrase stuck, though the second half has morphed over time, moving from St. Leger Day-which usually falls in early or mid-September-to October-ish (depending on who you ask). The Stock Trader's Almanac, which is basically D'Aulaires' Book of Seasonal Myths, says to sit out the entire May through October period, citing inferior average returns during May - October than November - April.
This is where Sell in May's trouble begins. Average returns since 1926 are indeed lower from May to October (4.2%) than from November through April (7.4%)[i]. But avoiding a positive 4.2% return over six months isn't exactly a winning ticket to long-term growth. May to October returns have been positive roughly 72% of the time during that stretch-May sellers are far likelier to miss growth than avoid downside. Of the 26 times when staying out from May through October would have "worked," 14 occurred when stocks were already in a bear market-bear markets that had zippo to do with calendar pages. (See Exhibit 1) Of the 13 bear markets since 1926, six began between May and October 31-a coin flip. Two of those (1929 and 2007) began toward the end of the range. Only one began in May, the 36-month bear market that ran from 5/30/1946 - 6/13/1949. There is nothing magical about May. It is a month.
Exhibit 1: Distribution of May to October Stock Market Returns 1926-2014
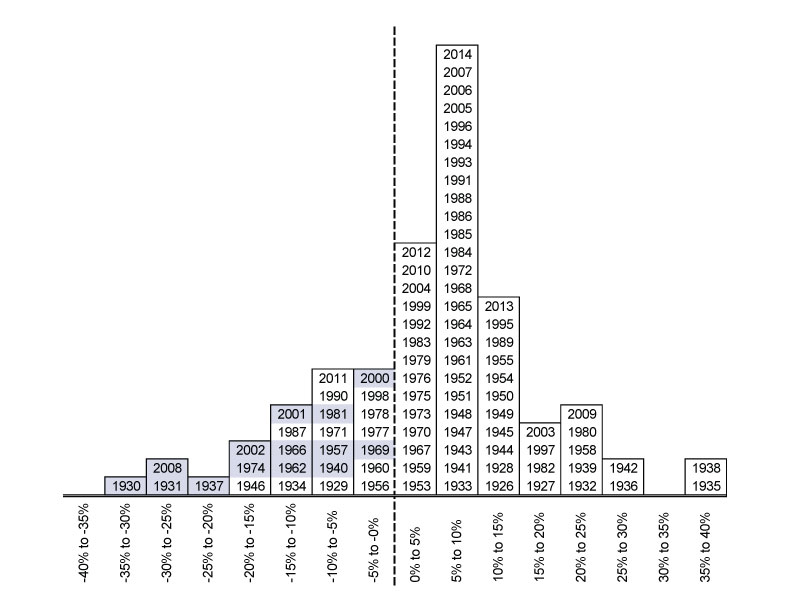
Source: Global Financial Data, Inc., as of 4/2/2015. S&P 500 Total Return Index, 12/31/1925 - 12/31/2014, returns from 4/30 through 10/31 of each year. Shaded boxes indicate bear markets were already in progress when May began.
Breaking down monthly returns further destroys the idea summer is a bummer for stocks. Every month but September is positive on average.[ii] Even May! Heck, July has the highest average monthly return, a counterpoint most of the seasonal-ites ignore. (We guess "Sell in May, come back on July 1, then sell on July 31 and go away, etc." lacks a certain rhymey charm?) In 2013, following the adage to a T would have dropped world stocks' 26.7% calendar year return to 15.5%. In 2014, it would have nearly halved returns, from 4.9% to 2.7%. In 2009, sell in May would have dropped returns from 30% to just 3.8%.[iii] Being out of the market from May to October without a strong, fundamental reason (calendars aren't fundamentals) exposes you to a high risk of missing out on gains.
Even if markets declined at some point during the summer, you would need to get back in at the right time to make sitting out worthwhile (especially once you factor in transaction costs and tax considerations). Corrections don't conveniently bottom in late October. That is another reason Sell in May's track record is so darned spotty. It often depends on corrections, which strike for any or no reason and are utterly unpredictable. 2012's correction began on March 19, but stocks rallied nicely from June to September, eking out a small gain during the Sell in May window. 2010's second correction started on April 15, and stocks bottomed July 5. 2011's first correction stacked up ok-ish with Sell in May, running from July 7 to October 4. But that had far more to do with euro collapse dread than the season. Plus, the second correction ran from October 28 through November 25, greeting all potential sell-in-May returnees with a -12.5% drop. 1998 also saw a big correction during the Sell in May window, but that stemmed from fears of contagion from the Russian ruble crisis-and stocks bottomed in early October. Sell in May doesn't work any better at the end than at the beginning.
Markets pretty efficiently discount all widely known information-including seasonal adages. Expectations for stocks to sag in summer are already priced. If the strategy worked, investors would catch on, some would likely sell earlier to get a leg up, then that would catch on, and eventually you'd be selling in April to avoid May. Any given year, you can probably find some index to show Sell in May "works," but anecdotal evidence doesn't prove anything. It's all pub trivia, not an actionable investment approach.
Stocks don't move on calendars. They move on fundamentals, like future economic growth and corporate profits. In the very short term they move on sentiment, which is far, far less predictable than when April flips to May-and impossible to time repeatedly with precision. Thinking longer-term and tuning out mythology is a better approach.
[i] Source: Global Financial Data, Inc. as of 4/2/2015; S&P 500 Total Returns from 12/31/1925 - 12/31/2014
[ii]For those scoring at home, September-the only negative month-is the month of St. Leger Day.
[iii] FactSet, as of 5/27/2015. MSCI World Index returns with net dividends, compound return from 12/31 - 4/30 and 10/31 - 12/31 in 2009, 2013 and 2014; and full-year returns in 2009, 2013 and 2014.
If you would like to contact the editors responsible for this article, please message MarketMinder directly.
*The content contained in this article represents only the opinions and viewpoints of the Fisher Investments editorial staff.
Get a weekly roundup of our market insights
Sign up for our weekly e-mail newsletter.

You Imagine Your Future. We Help You Get There.
Are you ready to start your journey to a better financial future?

Where Might the Market Go Next?
Confidently tackle the market’s ups and downs with independent research and analysis that tells you where we think stocks are headed—and why.
Related Resources
-
Market Analysis The New Tariffs in Town Are Still Old News2026-07-24
-
Expert Commentary This Week in Review | Market Volatility, Tariffs, SpaceX
 2026-07-24
 -
Economics A Summertime Check-in on US Consumers2026-07-23
-
Expert Commentary Why Ken Fisher Is Optimistic About European Stocks
 2026-07-23


Learn More
Learn why 210,000 clients trust us to manage their money and how Fisher Investments and its affiliates may be able to help you achieve your financial goals.
As of 6/30/2026
New to Fisher? Call Us.
Contact Us Today