Personal Wealth Management / Economics
This Week in US Data
Because everyone wants a little data along with their Royal Wedding coverage and Yanny vs. Laurel debates, right?

While Americans spent this week obsessing over Saturday’s Royal Wedding and whether that soundbite said “Yanny” or “Laurel,” a healthy spate of US economic data hit the wires, giving some strong evidence that Q1’s economic slowdown was indeed a temporary soft patch. While past data aren’t predictive for forward-looking stocks, the latest roundup does suggest economic fundamentals remain quite nice and should keep supporting earnings and revenues.
The fun started Tuesday, when the Census Bureau released April’s retail sales results. Overall, sales rose 0.3% m/m, adding to March’s revised 0.8% increase. So for those keeping score, we had two nicely positive months follow three rocky ones, with the lean times concentrated in winter. While rising gas prices bear some of the responsibility for April’s rise, they don’t explain it. Even excluding the 0.8% month-over-month rise in gas station sales, total sales still rose 0.25%, a rounding error behind headline sales’ 0.298% rise. (Literally—both round to 0.3%.) Some coverage interpreted this as Americans finally spending their gains from tax cuts, but that seems a smidge overstated to us. As do worries about higher gas prices eventually cutting into spending—that presumes lower prices were huge stimulus. They weren’t. As Exhibit 1 shows, non-gas station sales growth didn’t change much after June 2014, when oil prices began their long, deep tumble. In our view, recent months’ growth is consistent with the long-term trend, which existed well before tax cuts, of spending inching up in sympathy with incomes.
Exhibit 1: Gas Prices Have Less Impact on Discretionary Spending Than Many Folks Think
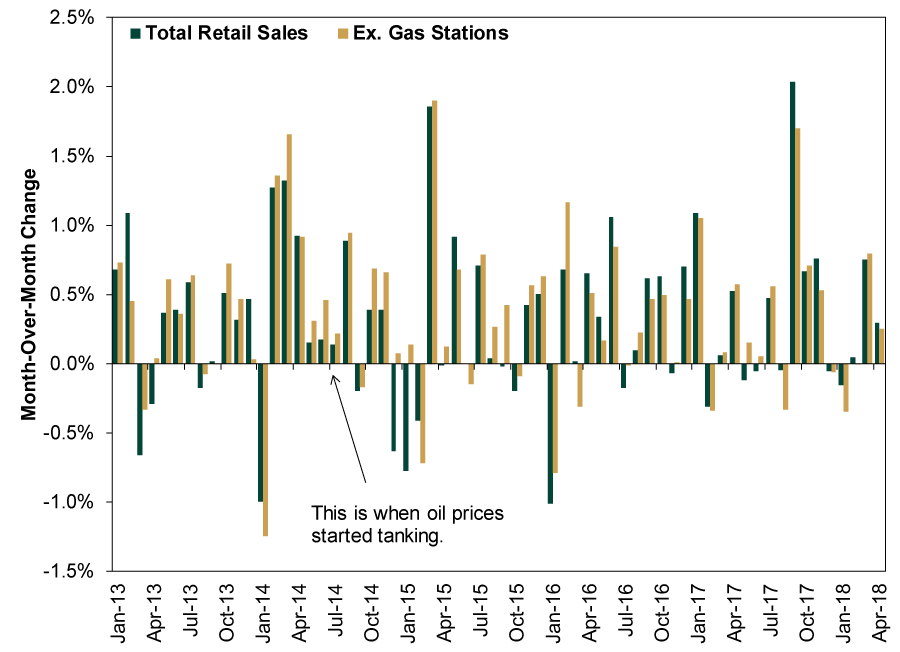
Source: FactSet, as of 5/18/2018. Retail & Food Service Sales and Gasoline Station Sales, January 2013 – April 2018.
Factories got their turn in the spotlight on Wednesday, when the Fed released April industrial production. Total production rose 0.7% m/m, with pure manufacturing output rising 0.5%, building off its ever-so-slight 0.02% gain in March. Mining output rose 1.1% m/m as oil producers kept pumping away, and utilities output growth slowed to 1.9% as winter thawed and folks turned off the heat. While these are all fine numbers, the Fed also revised down manufacturing results from November through March, making headlines a bit sad. Some argued the downward revision “cast a shadow over the economic outlook,” but we think that gives too much power to old, backward-looking numbers. With factory orders growing nicely and rising oil prices encouraging more activity in US shale fields, heavy industry seems to have plenty of life left. It is also a small slice of the US economy, which tilts heavily toward services.
Thursday brought one of our favorite indicators, The Conference Board’s Leading Economic Index. It rose 0.4% m/m in April, extending its very long uptrend, with 8 of 10 components contributing positively. The two detractors, stocks and building permits, are, respectively, volatile and not terribly influential for the vast majority of the US economy. Meanwhile, the two most telling components—the interest rate spread and Leading Credit Index—contributed positively, albeit at slightly lower rates than in March, signaling companies have plenty of access to capital.
Speaking of which, Thursday also brought the Fed’s latest loan growth data, which showed a continued recovery in business lending—up 14% annualized in April—and an acceleration in total loan growth to 5.9% annualized. Lest this spark your inflation fears, however, these are annualized rates—the full-year growth rates the monthly rates would translate too, all else equal. On a pure month-over-month basis, business lending rose just 1.2%, while total lending rose 0.5%. Broad M4 money supply actually slowed in April, from March’s 5.1% to 4.6%, the slowest growth rate since last August. Nothing here looks terribly inflationary, in our view.
Rounding out the week on Friday, Baker Hughes released its weekly update on oil & gas rig count, showing drillers added—wait for it—one natural gas rig this week. We will wait while you pop the champagne. Pure oil rig count was unchanged at 844 but is up by over 120 over the past year as rising prices encouraged more exploration and production. This doesn’t seem to be extending the global supply glut, as US oil stockpiles have come down quite a bit, suggesting supply and demand are largely in balance, but it does argue against rapidly rising oil prices from here—perhaps giving consumers one less thing to fear.
Oh, and for the record, three of your friendly MarketMinder editors heard Laurel, one heard Yanny, and two shall remain a mystery, because mysteries are fun.If you would like to contact the editors responsible for this article, please message MarketMinder directly.
*The content contained in this article represents only the opinions and viewpoints of the Fisher Investments editorial staff.
Get a weekly roundup of our market insights
Sign up for our weekly e-mail newsletter.

You Imagine Your Future. We Help You Get There.
Are you ready to start your journey to a better financial future?

Where Might the Market Go Next?
Confidently tackle the market’s ups and downs with independent research and analysis that tells you where we think stocks are headed—and why.
Related Resources
-
Market Analysis A Forward-Looking Lesson One Year After Liberation Day2026-04-02
-
Market Volatility Some Timeless Counsel After March’s Volatility2026-04-01
-
Market Analysis Countertrends and Corrections: Banks in 2026’s Early Selloff2026-04-01
-
Market Analysis What the Latest Global Flash PMIs Reveal2026-03-31


Learn More
Learn why 200,000 clients trust us to manage their money and how Fisher Investments and its affiliates may be able to help you achieve your financial goals.
As of 3/31/2026
New to Fisher? Call Us.
Contact Us Today