Personal Wealth Management / Economics
Three Views of US GDP
Friday’s US GDP report showed continued bifurcation between America’s public and private sectors.

The song remains the same.
Perhaps that’s the major takeaway from Friday’s preliminary US Q2 2012 GDP report, which showed real GDP growth decelerated to +1.5% in the quarter from Q1’s upwardly revised 2.0%. A tepid headline rate, to be sure—though it exceeded analysts’ estimates—which led to predictable headlines discussing the supposedly infirm state of the US economy. (Headline-fretting of the type Fisher Investments’ founder and CEO Ken Fisher has frequently alluded to.)
Far be it from us to argue the US is growing at a gangbusters clip because it isn’t. But the reality is it’s also not as dire as is commonly reported. In fact, the headline number and some of GDP’s calculation quirks obscure a healthy and growing private sector.
One major drag on GDP growth in recent quarters has been government spending, which GDP’s calculation treats as an automatic positive when it increases. So if one seeks solely a bigger GDP number and not necessarily innovative economic growth, step on the fiscal gas and launch a debt-fueled spending binge. But of course, that doesn’t necessarily reflect economic health or even that the money was well spent. In that way, reduced government spending lowering headline GDP may not be a bad thing.
In Q2, government spending detracted about -0.3% percentage point from the headline figure—meaning growth excluding the public sector was 1.8% in the quarter. Again, not gangbusters, but better than many appreciate. But that figure’s for only one quarter. Exhibit 1 plots cumulative change in headline real GDP (red line) versus real GDP excluding government spending (blue line) in the present economic expansion. As depicted, government expenditure has weighed on GDP.
Exhibit 1: Cumulative Percent Change in Real GDP and Real GDP Ex-Government Spending
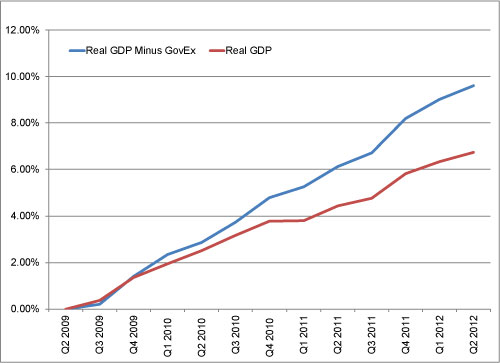
Source: US Bureau of Economic Analysis. Q2 2009 – Q2 2012.
At a more granular level, the government spending drag in recent quarters is easy to see. Exhibit 2 plots business investment (gross private domestic investment), consumer spending and government spending.
Exhibit 2: Cumulative Percent Growth in Selected GDP Consumption Metrics
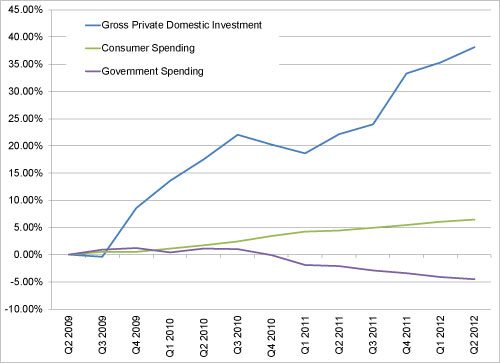
Source: US Bureau of Economic Analysis. Q2 2009 – Q2 2012.
In Q2, total nominal government spending (federal, state and local combined) was at an annualized pace of $3.048 trillion—a big figure, no doubt, but inflation-adjusted spending is at levels last seen in Q1 2008. This reduced spending amounts to austerity by definition, and yet the highly competitive US private sector has grown quickly enough to more than offset the dipping government spending. (So maybe austerity isn’t the death sentence so many pundits presume. See also: Ireland, Canada in the 1990s and more.)
And as we’ve written, GDP’s accounting for international trade (net exports) presumes imports detract from economic health—a falsehood. In Q2, imports alone subtracted over 1.0% from growth. This trend, too, isn’t terribly new—accounting for imports was a huge skew at points in 2010. Exhibit 3 shows imports’ effect in the current economic expansion, removing trade altogether from the picture.
Exhibit 3: Cumulative Percent Change in GDP
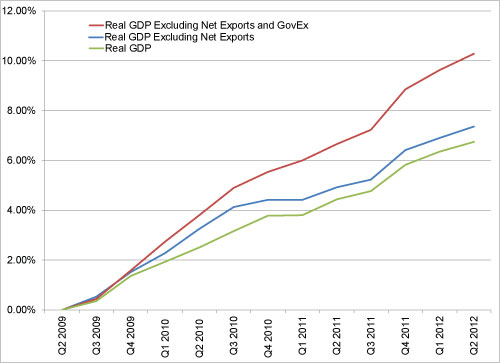
Source: US Bureau of Economic Analysis. Q2 2009 – Q2 2012.
Now, we’re not arguing stripping out these factors is necessarily an inherently superior way to view GDP or economic growth. We’re merely arguing one shouldn’t necessarily take GDP figures at face value, as they’re inherently a bit wonky and aren’t the tell-all some suppose.
So no, the US economy isn’t exactly growing at a torrid pace. But the private sector—the most pertinent part of the economy to the majority of investors—is, in fact, much more healthy than headline data might otherwise suggest.
If you would like to contact the editors responsible for this article, please message MarketMinder directly.
*The content contained in this article represents only the opinions and viewpoints of the Fisher Investments editorial staff.
Get a weekly roundup of our market insights
Sign up for our weekly e-mail newsletter.

You Imagine Your Future. We Help You Get There.
Are you ready to start your journey to a better financial future?

Where Might the Market Go Next?
Confidently tackle the market’s ups and downs with independent research and analysis that tells you where we think stocks are headed—and why.
Related Resources
-
In The News Around the World in Tax Policy Talk2026-05-15
-
Expert Commentary This Week in Review | US Inflation, US-China Visit, Fed Chair Confirmation
 2026-05-15
 -
Market Analysis Reader Mailbag: May 20262026-05-14
-
Politics The UK’s Political Ructions Hide a Better-Than-Feared Economy2026-05-14


Learn More
Learn why 200,000 clients trust us to manage their money and how Fisher Investments and its affiliates may be able to help you achieve your financial goals.
As of 3/31/2026
New to Fisher? Call Us.
Contact Us Today