Personal Wealth Management / Economics
Trading Up?
June’s trade report is getting applause, but not for the reasons it should.

The US trade deficit fell by 22.4% to $34.2 billion in June, the smallest gap in over three years. Some cheer this as a positive for economic growth. After all, a shrinking deficit detracts less from headline GDP—GDP counts net exports, and the US is a perennial net importer. In our views, the cheers are misplaced. Not because the trade data were bad—in our view, they were just fine. Rather, in our view, the common analysis of the report is wrong, and investors should approach it from a different angle.
The problem is in thinking a trade deficit is always and everywhere a negative and a surplus positive. Falling imports would narrow a deficit or create a surplus—adding to headline GDP—but that wouldn’t necessarily be positive. Imports can be an important indicator of domestic demand! Falling imports often precede or coincide with recessions. We believe total trade (exports plus imports) gives you better insight into economic health.
Seen that way, total trade fell slightly for June. Time to panic? Not really—month-to-month data are volatile. Looking at the longer trend, total trade has been increasing since 2009. (See Exhibit 1.) And June’s data weren’t uniformly weak. Total exports rose 2.2% m/m to $191.2 billion, an increase of $4.1 billion from May—and an all-time high. It seems foreign demand remains firm.
Exhibit 1: Annual US Total Trade 2006-2012
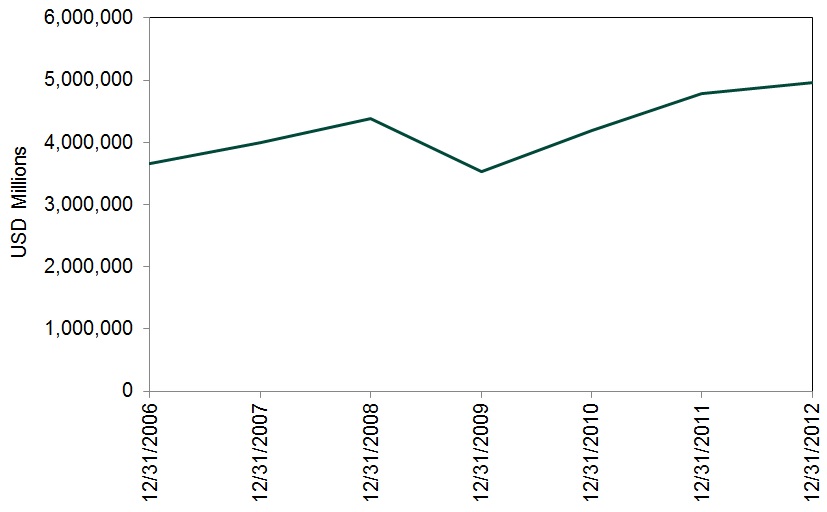
Source: US Census Bureau. Data accessed 8/7/2013.
Total imports fell about 2.5% m/m, to $225.4 billion, falling about $5.8 billion from May. But why did imports fall? Partly due to a 6.3% drop in petroleum imports—but that’s tied more to rising domestic production, not a drop in demand. Exhibit 2 shows consumption has held pretty steady while the increase in US production about matches the decrease in oil imports in recent years. Thanks to the shale oil boom, petroleum imports have been falling steadily recently—this isn’t a recent anomaly. Exhibit 3 shows petroleum imports falling in recent years while non-petroleum imports have overall risen. Non-petroleum imports fell in June too, but the drop was shallower (-3.5%). Again, not terrific, but trade data are normally volatile and the overall trend has been positive.
Exhibit 2: US Oil Production, Imports and Consumption
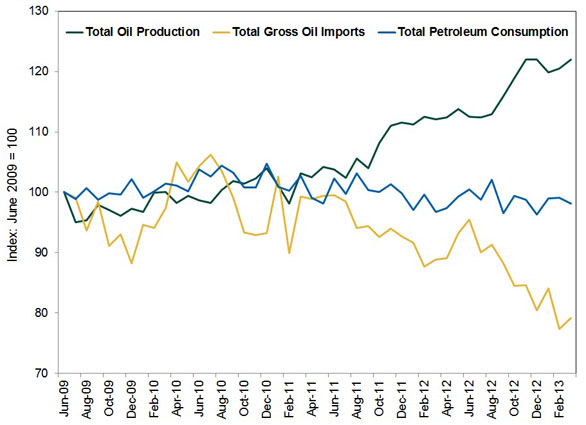
Source: US Energy Information Administration. Data accessed 8/6/2013.
Exhibit 3: 12-Month Moving Average of Petroleum and Non-Petroleum Imports
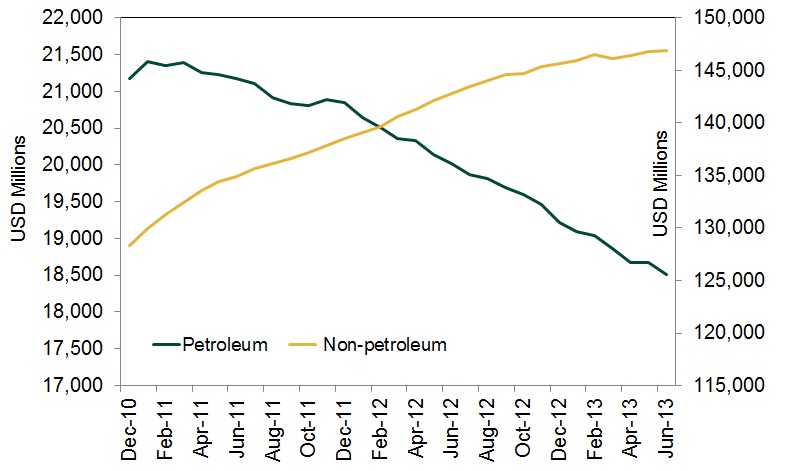
Source: US Census Bureau. Data accessed 8/6/2013.
If you would like to contact the editors responsible for this article, please message MarketMinder directly.
*The content contained in this article represents only the opinions and viewpoints of the Fisher Investments editorial staff.
Get a weekly roundup of our market insights
Sign up for our weekly e-mail newsletter.

You Imagine Your Future. We Help You Get There.
Are you ready to start your journey to a better financial future?

Where Might the Market Go Next?
Confidently tackle the market’s ups and downs with independent research and analysis that tells you where we think stocks are headed—and why.
Related Resources
-
Expert Commentary This Week in Review | Q1 Recap, Earnings Guidance, Elections
 2026-04-03
 -
Market Analysis A Forward-Looking Lesson One Year After Liberation Day2026-04-02
-
Market Volatility Some Timeless Counsel After March’s Volatility2026-04-01
-
Market Analysis Countertrends and Corrections: Banks in 2026’s Early Selloff2026-04-01


Learn More
Learn why 200,000 clients trust us to manage their money and how Fisher Investments and its affiliates may be able to help you achieve your financial goals.
As of 3/31/2026
New to Fisher? Call Us.
Contact Us Today