Personal Wealth Management / Economics
US Q3 GDP Solid, Media Take Largely Skeptical
The advance estimate of US GDP showed growth exceeded analysts' estimates and continued at a respectable clip-yet media skepticism was easy to find.

The advance estimate of US Q3 2014 GDP hit Thursday, data showing the world's largest economy grew at a 3.5% seasonally adjusted annual rate (SAAR) in the quarter. It's a deceleration from Q2's 4.6%, but still respectable-and above the US's post-war average growth rate. It also topped analysts' estimates of 3.0%. Now, this report will be revised and revised, then probably revised again much later, and revised yet again each and every time the US Bureau of Economic Analysis (BEA) decides to rejigger the tally, which it does every few years.[i] But still, the reading confirms US expansion continued in Q3. And the reaction to this data suggests skepticism remains-showing investors aren't irrationally celebrating today.
Here is a collection of factoids from the report:
- Consumer spending rose 1.8% in Q3, adding 1.2 percentage points to growth.
-
Gross private investment-the broad category including business investment in structures, equipment, R&D, residential real estate and inventory change-rose 1%, adding a measly 0.17 percentage point to growth.
- But before you jump on the "businesses' aren't spending" bandwagon consider: business investment in structures, equipment and intellectual property rose 3.8%, 7.2% and 4.2%, respectively-adding a combined 0.68 percentage point to growth.
- Residential real estate also positively contributed, with its 1.8% SAAR adding 0.06 percentage point to growth.
- The category's overall meager 0.17 percentage point contribution to growth was due to inventories falling, which detracted 0.57 percentage point from headline GDP.
- Government spending was basically flat save for national defense, which rose by 16.0%, contributing two-thirds of a percentage point to growth.
-
Net exports added 1.32 percentage points to growth, though this wasn't all rosy news.
- Exports rose 7.8% SAAR in the quarter, but imports fell -1.7%. Falling imports add to GDP but can indicate weakening demand-eek-though we believe there are likely extenuating circumstances here.[ii]
Here is a picture.
Exhibit 1: Contributions to Headline Real GDP Growth (In Percentage Points)
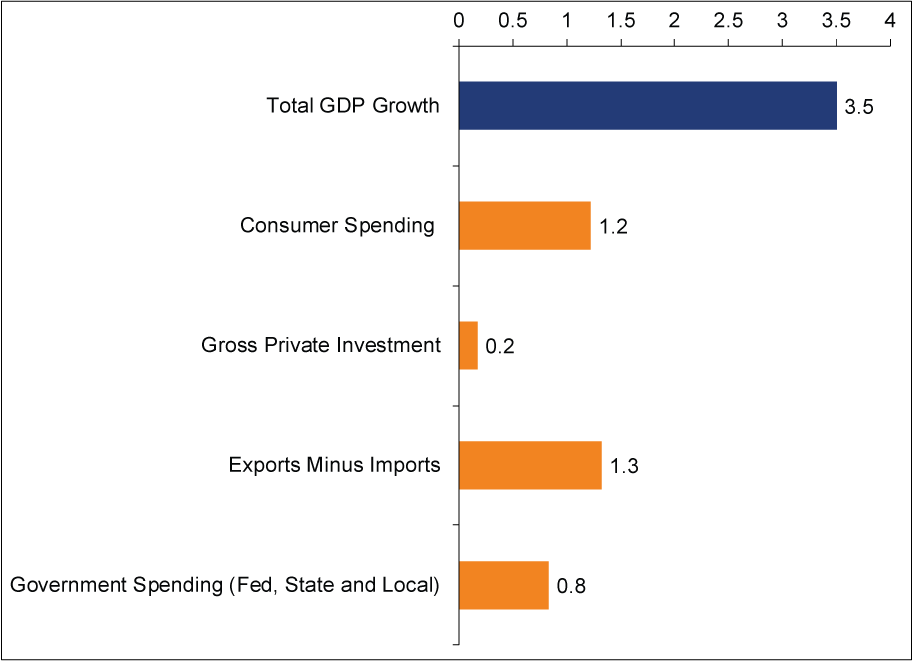
Source: US Bureau of Economic Analysis. All figures are at seasonally adjusted annual rates.
As for the media take, this was a mixed bag. Many hailed the quarter's solid growth but also suggested it isn't likely to repeat.
As one put it, "One question now is how the economy will fare amid a global growth slowdown that has strengthened the dollar, hurting U.S. exporters....." Yet there is scant evidence the globe is so much weaker now than it has been for years, and the dollar rose sharply in Q3-while exports grew 7.8%. Hard to see how such a weak world gobbled up more expensive US goods at a quick clip-unless that theory is a wee bit wide of the mark. Now, export figures will be revised[iii], but barring a really dramatic shift, seems like the world kinda helped US growth, not the opposite.
Another odd thing the media did was use strange analogies to sports with little relevancy to the data. Like this one, from an article quick to label this GDP report a non-game changer: "The U.S. economy expanded at a 3.5% annualized rate in the third quarter. What's that mean? Is that a San Francisco Giants World Series game seven, historic for-the-ages victory? Or is it more like a New York Mets, mid-July win: nice, but you have a distinct fear that it's not going to amount to much of anything?" We will award one point to this analogy for timeliness, but whaaaaaaaaaat? We are going to subtract five points for confusion. First, the claiming the US economy needs a growth "game changer" is itself a swing-and-a-miss[iv]-but importantly, what do any of the other words actually mean? We are talking about a three-month stretch during Year Six of an economic expansion-why do we even need a false choice about its significance? It is just a backward-looking thing.
Still another dour take in the media claims that "It Was a Good Summer for the Economy, but the Future Looks Less Bright." It's all based on digging into the advance estimate's underlying components claiming (bizarrely) that headline GDP growth is backward looking, so you need to look at the underlying components to see where it will go. (Never mind that all those data are old, too.[v]) Underlying data-the same growthy underlying data we show above-are illustrative, confirming growth. A way to test a thesis! Have businesses spent? Yes. Will they continue to? These data won't show that. Can you infer some things about the future? Sure, but you can do that from any data. This, folks, is why we've often suggested forward-looking gauges, like The Conference Board's US Leading Economic Index-which rose again in September-are crucial.
The same article claims the growth pickup over the last year hasn't gotten us out of a deep ditch dug by the 2008 recession and the subsequent slow recovery. The evidence? A comparison of "real" potential GDP to actual real GDP, showing we're still hundreds of billions behind where we should be. (Exhibit 2)
Exhibit 2: "Real" Potential GDP
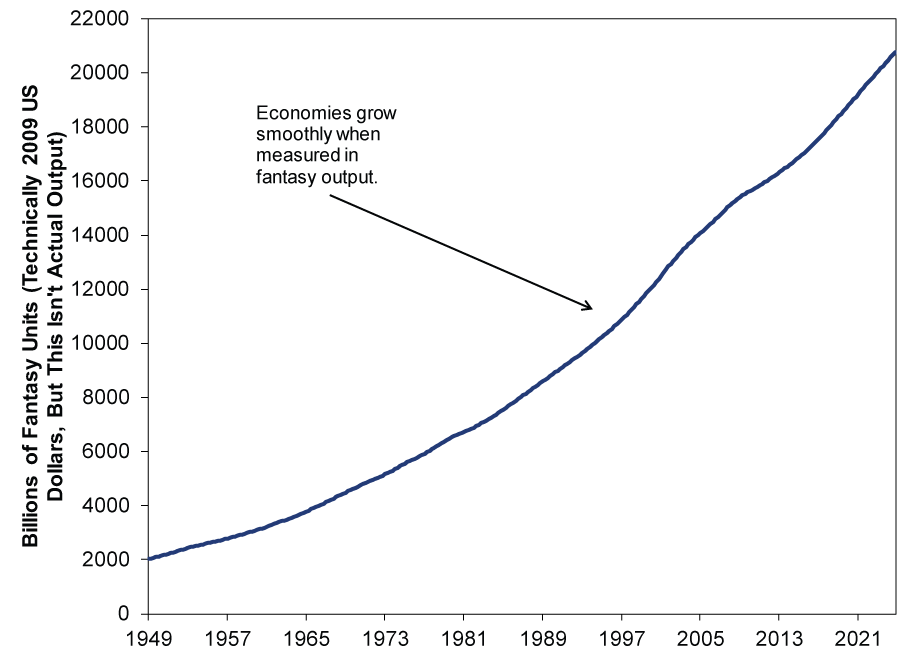
Source: Federal Reserve Bank of St. Louis. Real is supposed to mean inflation adjusted fake GDP, measured in 2009 dollars. Q1 1949 - Q4 2024 (yep-it goes a decade into the future).
Potential GDP is supposedly a measure of what US output should be if all the economy's cylinders were firing at max capacity. It doesn't much account for cyclical changes-like recessions-hence the smooth line up. We at MarketMinder call this "coulda-woulda-shoulda-been GDP," or "fantasyland output." Assuming you can know where the complex economy should be is the Pretense of Knowledge. Hence, having a dour view of the US economy because it is under potential GDP is a little like fearing being kicked by a unicorn. Oh and hey the gap is closing lately! See Exhibit 3.
Exhibit 3: "Real" Potential US GDP v. Real US GDP
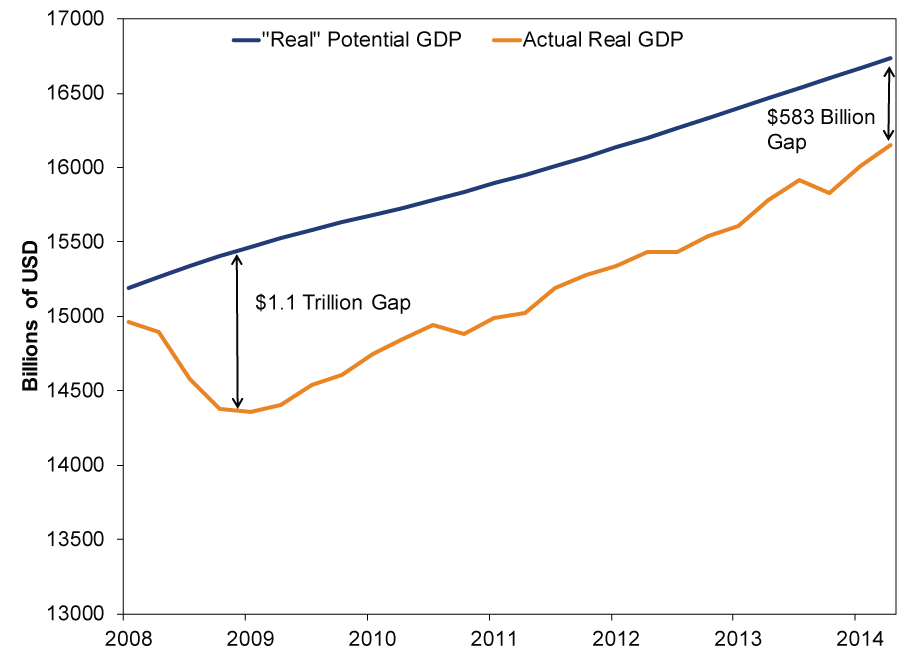
Source: Federal Reserve Bank of St. Louis, as of 10/30/2014. Q1 2008 - Q3 2014.
Near a bull market's peak, folks will look to just about any positive for confirmation their bullishness is justified. Today it's still pretty easy to find media takes doing the opposite-a sign sentiment is still bullishly undershooting reality.
Stock Market Outlook
Like what you read? Interested in market analysis for your portfolio? Why not download our in-depth analysis of current investing conditions and our forecast for the period ahead. Our latest report looks at key stock market drivers including market, political, and economic factors. Click Here for More!
[i]This isn't really a joke. There will be a second and third estimate of GDP over the next couple months, there is a look back years later, and then methodology is often reconfigured in an effort to improve accuracy. Sometimes that appears to be logical, like lumping in R&D spending and intellectual property values. Other times not as much.
[ii] Those extenuating circumstances are the shale oil boom reducing both oil imports and oil prices. However, we can't know this for certain yet, because the advance estimate of GDP doesn't include a full look at the quarter's trade, which is not even published yet.
[iii] And revised, and revised and probably revised some more.
[iv] See, that is how you use a baseball analogy, folks.
[v] Estimates subject to revision and revision and revision!
If you would like to contact the editors responsible for this article, please message MarketMinder directly.
*The content contained in this article represents only the opinions and viewpoints of the Fisher Investments editorial staff.
Get a weekly roundup of our market insights
Sign up for our weekly e-mail newsletter.

You Imagine Your Future. We Help You Get There.
Are you ready to start your journey to a better financial future?

Where Might the Market Go Next?
Confidently tackle the market’s ups and downs with independent research and analysis that tells you where we think stocks are headed—and why.
Related Resources
-
Market Analysis The Golden Paradox2026-03-24
-
Weekly Wrap-Up Fisher Investments Reviews: Last Week in Markets—March 16 - March 202026-03-23
-
Expert Commentary PMIs, Denmark Snap Election, Tax Season | 3 Things You Need to Know This Week2026-03-23
-
In The News How investors should think about oil and stocks in the Iran war – in 3 simple steps2026-03-23


Learn More
Learn why 195,000 clients trust us to manage their money and how Fisher Investments and its affiliates may be able to help you achieve your financial goals.
As of 12/31/2025
New to Fisher? Call Us.
Contact Us Today