Personal Wealth Management / Market Analysis
Volatility Returns
This week saw bigger swings return. Overthinking them is a key risk for investors today.

Friday, for the first time since September 9, 2016—353 trading days ago—the S&P 500 fell by more than 2% in a day.[i] This, coming on the heels of Tuesday’s -1.1% decline, capped off the rockiest week in a while, in which the S&P 500 and MSCI World fell -3.85% and -3.44%, respectively. 10-year yields rose some, hitting their highest point since 2013.
Those are all facts. But media, as is their stock and trade, jumped immediately to speculating about causes; where things go from here; what it all means. Most seemingly decided it was a freak out tied to those rising interest rates, which many presume spell trouble for stocks. Our simple suggestion: Tune it out. Maybe this is a correction. Maybe it is just fleeting negativity, poised to reverse next week. Maybe it is worse (we doubt it, but it is possible). A day, five days, even if this extends into next week, it just isn’t sufficient to know.
It has been a long time since single-day swings like this struck, so it is understandable if you feel a little shaken. Yet some perspective is in order. Neither a -2% day nor a nearly -4% week is fun, but you can’t automatically presume it is a harbinger of further declines to come. In this bull market alone, 52 single-day declines exceeded the S&P 500’s -2.12% Friday. 62 single-day MSCI World dips exceeded Friday’s -1.85%. If none of those spelled the bull market’s end, why presume Friday’s is different?
Exhibits 1 & 2 plot the occurrences of these drops. You will note some occur as parts of corrections. Others don’t. There isn’t a pattern.
Exhibit 1: MSCI World Index Dips Exceeding February 2, 2018
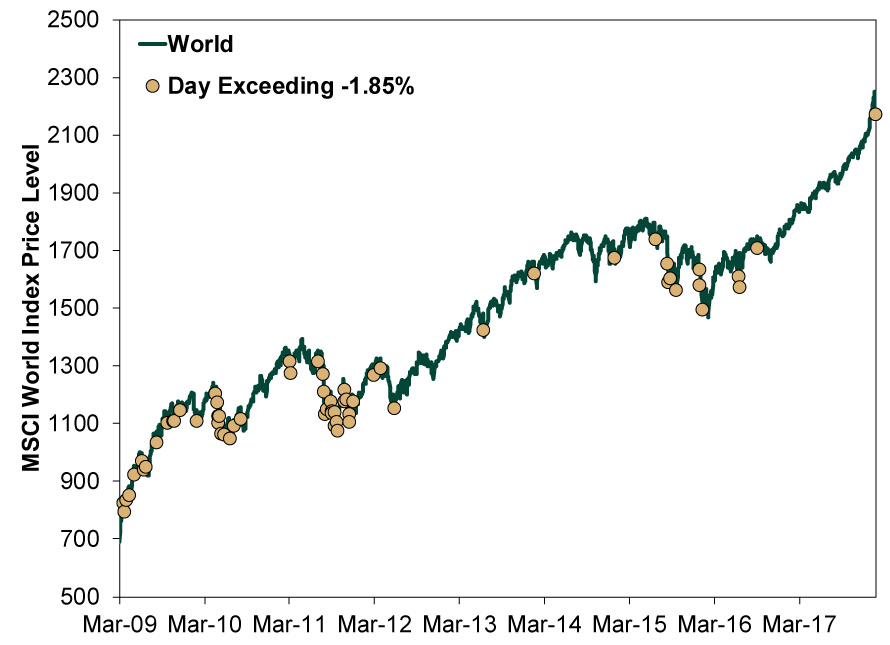
Source: FactSet, as of 2/2/2018. MSCI World price index return in USD, 3/9/2009 – 2/2/2018.
Exhibit 2: S&P 500 Dips Exceeding February 2, 2018
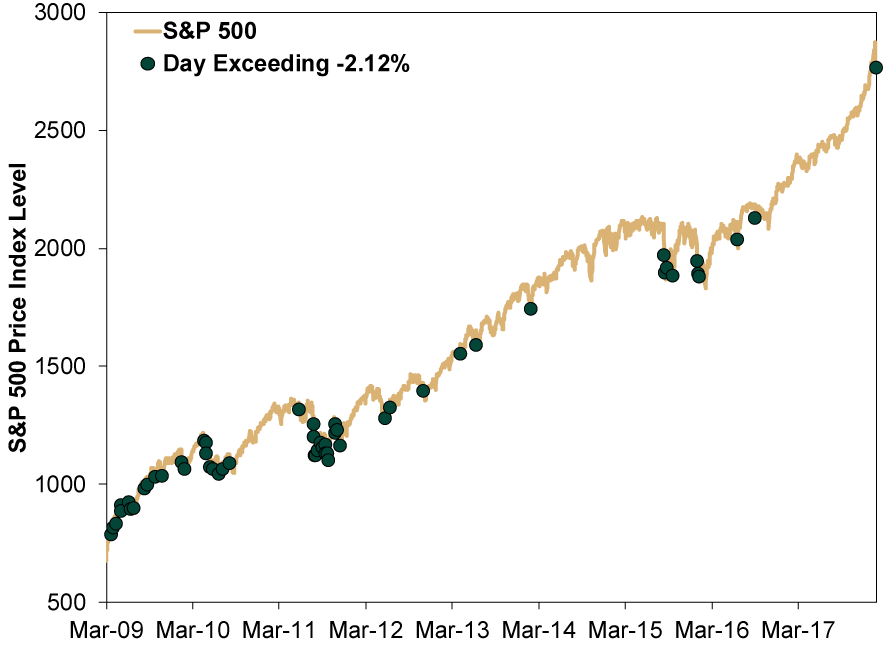
Source: FactSet, as of 2/2/2018. S&P 500 price index return, 3/9/2009 – 2/2/2018.
The weekly dip isn’t all that unusual, either. The S&P 500 has posted 69 rolling 5-day returns worse than this week’s -3.85% since this bull’s birth on March 9, 2009. The MSCI World? 101. Moreover, as Exhibits 3 & 4 show, not all those came five days removed from a record high.
Exhibit 3: MSCI World Index Rolling 5-Day Declines Exceeding 1/29/2018 – 2/2/2018
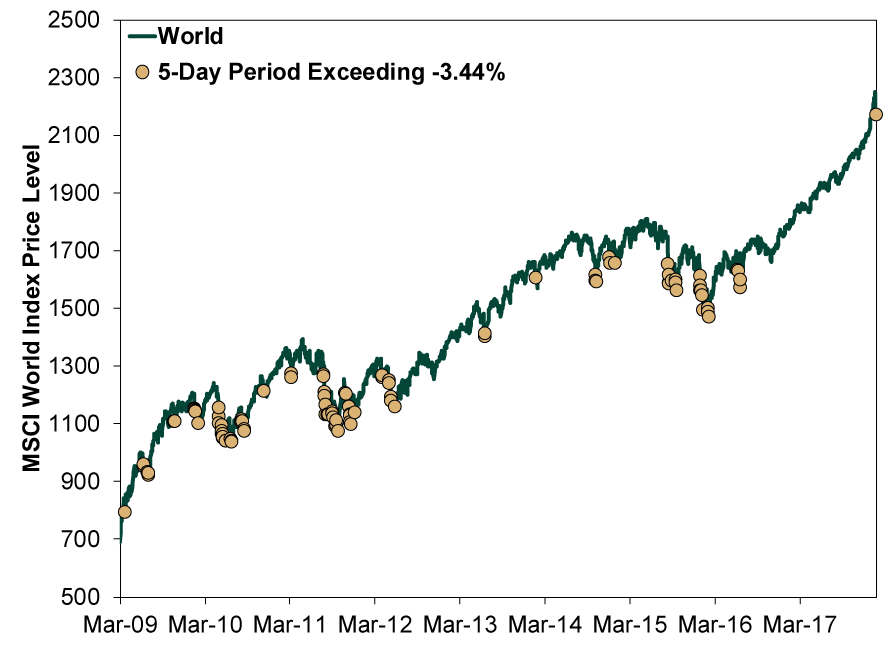
Source: FactSet, as of 2/2/2018. MSCI World price index return in USD, 3/9/2009 – 2/2/2018.
Exhibit 4: S&P 500 Rolling 5-Day Declines Exceeding 1/29/2018 – 2/2/2018
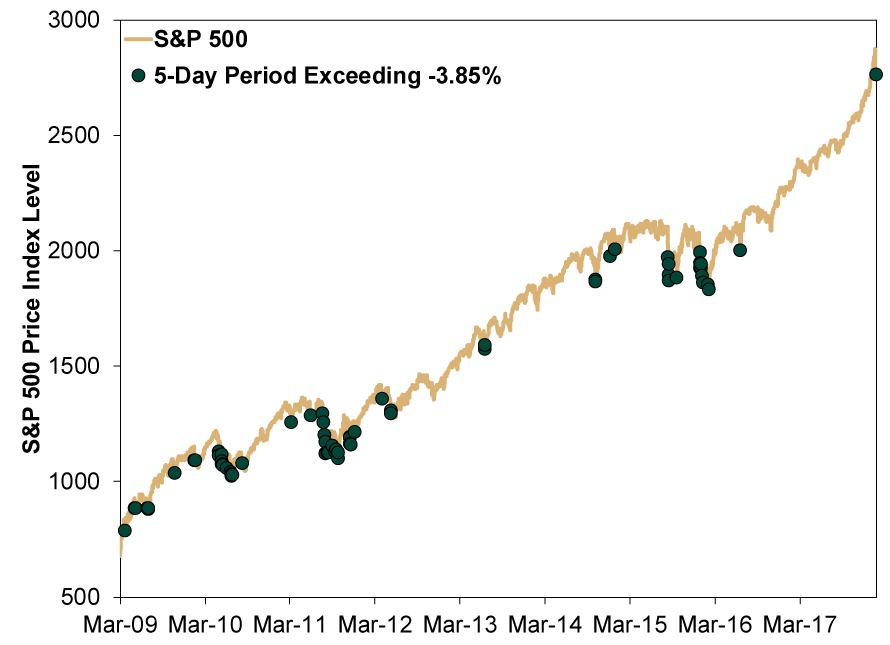
Source: FactSet, as of 2/2/2018. S&P 500 price index return, 3/9/2009 – 2/2/2018.
Consider that last point again: At this time last week, media went into the weekend touting stocks at record highs. Five days later, we have seen more data confirming economic growth was strong in late 2017 and January, with most forward indicators pointing up. On a macroeconomic basis, there hasn’t been anything troublesome.
Yes, 10-year Treasury yields are up. That is also a fact. But bond yields wiggle, too, as Exhibit 5 shows. While it has been a spell since we have seen a 10-year yield of 2.85%, it is worth noting the last time was 2013, which was a whopper year for global equities. Rising long rates to levels that aren’t historically high isn’t an automatic problem for stocks.
Exhibit 5: 10-Year Yields
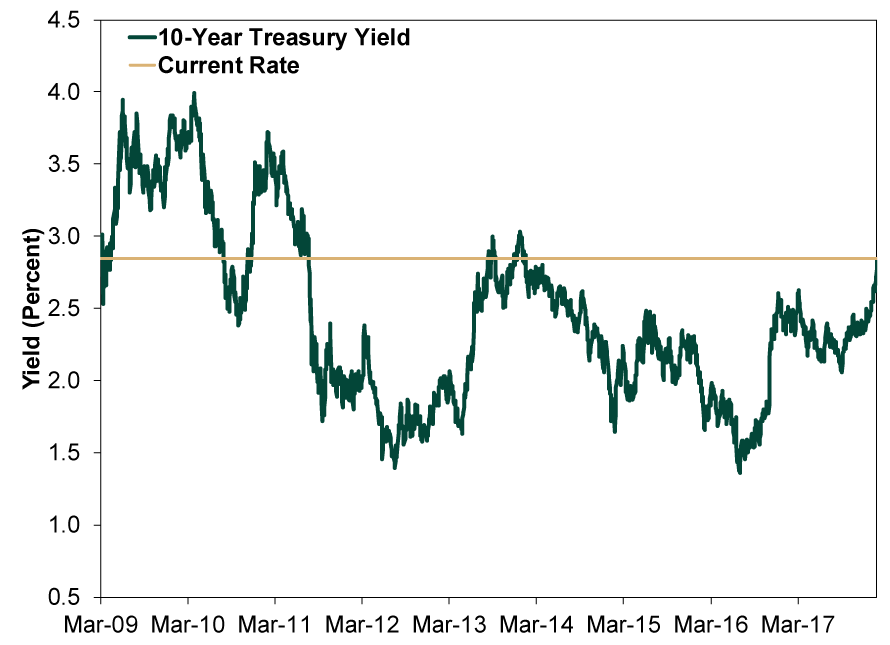
Source: FactSet, as of 2/2/2018. 10-Year US Treasury yield, 3/9/2009 – 2/2/2018.
What if they do stay higher for a spell? Well, consider: Rising long-term yields would steepen the yield curve (the difference between short-term and long-term rates). Since banks borrow short-term to fund longer-term loans, that implies fatter loan profits. More profitable lending typically means more plentiful lending—which is why steeper yield curves usually precede growth. The media, in its haste to fear rising rates, forgot it was afraid of flatter yield curves just last fall.
Ultimately, it is too soon to say how this unfolds. Again, by next week, this article may be totally irrelevant. But it is worth remembering that reacting to volatility—whether it is investors or the media doing it—is usually an error.
[i] Source: FactSet, as of 2/2/2018. S&P 500 Index price return and day count, 9/9/2016 – 2/2/2018.
If you would like to contact the editors responsible for this article, please message MarketMinder directly.
*The content contained in this article represents only the opinions and viewpoints of the Fisher Investments editorial staff.
Get a weekly roundup of our market insights
Sign up for our weekly e-mail newsletter.

You Imagine Your Future. We Help You Get There.
Are you ready to start your journey to a better financial future?

Where Might the Market Go Next?
Confidently tackle the market’s ups and downs with independent research and analysis that tells you where we think stocks are headed—and why.
Related Resources
-
In The News Bourse : pourquoi l’impact de la guerre en Iran sera moins important que prévu – par Ken Fisher2026-04-01
-
Market Analysis Countertrends and Corrections: Banks in 2026’s Early Selloff2026-04-01
-
Market Volatility Some Timeless Counsel After March’s Volatility2026-04-01
-
Market Analysis What the Latest Global Flash PMIs Reveal2026-03-31


Learn More
Learn why 200,000 clients trust us to manage their money and how Fisher Investments and its affiliates may be able to help you achieve your financial goals.
As of 4/1/2026
New to Fisher? Call Us.
Contact Us Today