Personal Wealth Management / Market Analysis
What Rising Deficits Mean for US Debt
Despite record spending to battle coronavirus containment’s fallout, we don’t think debt doom awaits.

US federal spending is surging thanks to a series of aid packages designed to alleviate COVID-19 containment measures’ economic toll. With the deficit all but assured to spike, we already hear lots of chatter about runaway debt risking eventual economic ruin. In our view, though, US debt still isn’t a looming economic or market catastrophe.
The scale of 2020 fiscal measures—both past and planned—is indeed significant. Congress has allocated $2.2 trillion in emergency aid to date.[i] The House just passed another $484 billion package targeted at small businesses that President Trump is set to sign, and most expect Congress to direct additional funds to states and municipalities next month. The result is a ballooning 2020 deficit. The Congressional Budget Office’s 2020 debt forecast, released in January, projected a $1.0 trillion annual deficit.[ii] According to a Bloomberg analysis, existing fiscal measures alone plus falling tax revenue could lift this to $3.8 trillion, well beyond 2009’s record-high $1.5 trillion.[iii] COVID-19-related restrictions on commerce likely hit GDP this year, too, potentially lifting America’s debt-to-GDP ratio past its 1946 peak of 106%—the result of heavy borrowing to fund the war effort.[iv]
While recently passed new spending and bailouts are big, they aren’t all permanent balance sheet entries. $454 billion thus far backstops Fed loans to small businesses.[v] To the extent these are repaid, the money isn’t spent. The Fed will also return interest on those loans to the Treasury, as it does all its profits, further defraying the cost. Another $211 billion represents deferred—but not canceled—employer payroll taxes.[vi] Those measures representing actual transfer payments are also likely a one-time splurge, not a new, permanently higher spending plateau. After 2009’s big increase, annual deficits fell for six straight years.[vii]
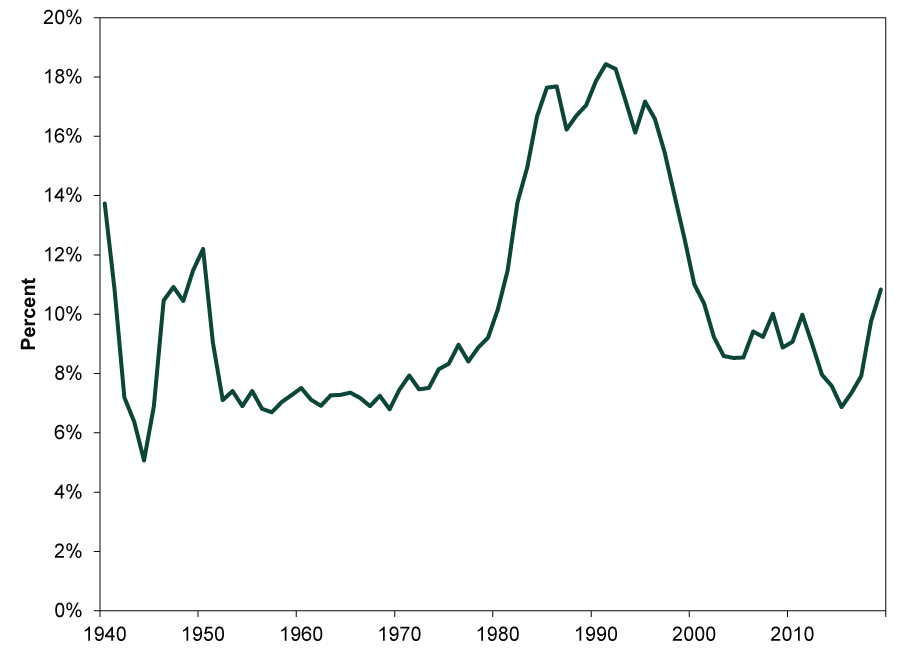
Deficit calculations aside, we think focusing on absolute amounts and comparisons to GDP is a mistake. Neither are meaningful measures of debt’s affordability or sustainability, in our view. Debt is an accumulated quantity built over decades. GDP is an annual flow of economic activity—apples and oranges. Also, governments pay creditors with tax revenues, not GDP—and those creditors primarily care about whether countries can pay interest and principal due. Hence, we think comparing interest payments to tax revenues is most apt. This ratio is bound to rise this year, thanks to more debt and lower revenues. But as Exhibit 1 shows, it has been far higher in the past without precipitating a debt disaster.
Exhibit 1: Federal Interest Payments as a Percentage of Tax Revenue
Source: Federal Reserve Bank of St. Louis, as of 4/22/2020. Annual interest outlays on Federal debt divided by Federal tax receipts, fiscal years 1940 – 2019. Fiscal years 1940 – 1976 end on June 30, fiscal years 1977 – 2019 on September 30.
Another force keeping borrowing costs manageable is today’s historically low Treasury yields, which also let the Treasury refinance maturing debt at cheaper rates than it was issued. Consider: a 10-year bond issued in May 2010 and maturing next month had a 3.5% coupon.[viii] Given the 10-year bond is currently trading at 0.6%, it is highly likely that when it comes time to refinance, the Treasury will be able to pay well under the maturing rate.[ix] That helps buy time for economic growth to reduce debt-to-GDP and raise the tax base. This is how America “fixed” high debt after WWII. By 1974, net public debt was down to 23.2% of GDP—but not because we had paid it off.[x] In dollars, debt rose from $42.8 billion to $343.7 billion.[xi] But the economy simply grew, generating the cash to pay the interest as well as the demand for more government borrowing. That WWII-era debt remains on the books today, refinanced multiple times.
In our view, this is the most beneficial way to handle government debt. Paying it off, though appealing at a political or emotional level, isn’t the same as paying down your mortgage. There is no prize waiting at the end. Rather, it would likely be contractionary, given US Treasurys are a fundamental underpinning of the global banking system. Reduced access to high-quality collateral like Treasury bonds would prevent banks globally from lending as much. It may also wreak havoc on global central banks, which rely on deep, liquid US Treasury markets to fill out their foreign exchange reserves.
Low interest rates also reflect presently minimal investor concern about the US’s ability to pay. Given the bond market efficiently discounts all public information, we think this is a pretty reliable sign rising debt isn’t impairing Uncle Sam’s creditworthiness.
Some fear a flight to quality—investors’ fleeing stocks for the perceived safety of bonds—is holding rates down temporarily, setting up a spike later as investors shift their focus to huge deficits, rendering debt unaffordable. It is probably true that higher demand during an equity bear market and economic contraction is weighing on rates somewhat, and it wouldn’t surprise us if they drifted higher as those factors ease. But a sudden spike seems unlikely.
For one, higher debt issuance in recent years (and especially months) has accompanied generally falling rates, as Exhibit 2 shows.
Exhibit 2: Debt Rises, Treasury Yields Fall
Sources: Federal Reserve Bank of St. Louis and the Office of Management and Budget, as of 4/23/2020. 10-year US Treasury yield (constant maturity), April 2005 – March 2020; annual increase in net public debt, 2005 – 2019.
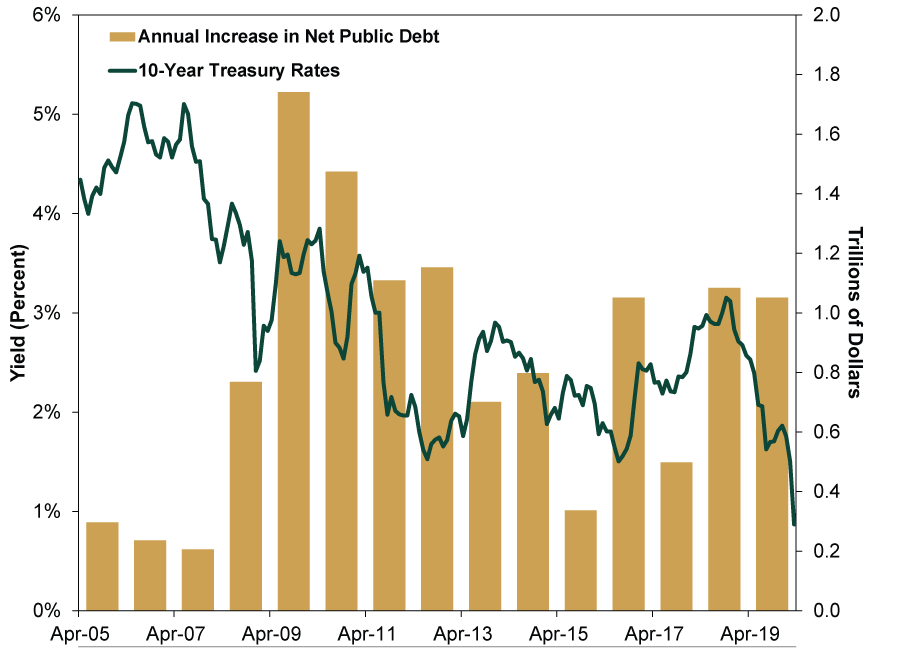
This despite all the events many claimed would cause rates to surge over the last decade—like a recession, financial crisis and bear market, 2009’s big deficit, 2011’s credit downgrade, several Congressional debt ceiling standoffs, China selling US Treasurys and more. The reason rates broadly kept falling, in our view: very high investor demand has exceeded new supply. Yes, the Fed’s bond purchases (via quantitative easing) are one demand source. But governments, institutions, banks, central banks and individual investors worldwide value Treasurys for their perceived safety, stability, low credit risk and attractive yields relative to much of the developed world. We don’t think these factors are changing any time soon. Moreover, since the Treasury issues most debt at fixed rates, higher rates would only apply to newly issued debt. Since the average maturity of Treasury debt is currently 69.9 months, rates would have to rise a lot and stay elevated in order to significantly increase servicing costs.[xii] This is unlikely today, in our view.
[i] “U.S. Debt to Surge Past Wartime Record, Deficit to Quadruple,” Christopher Condon and Dave Merrill, Bloomberg, 4/21/2020.
[ii] Source: The Congressional Budget Office, as of 4/22/2020. https://www.cbo.gov/publication/56073
[iii] Sources: “U.S. Debt to Surge Past Wartime Record, Deficit to Quadruple,” Christopher Condon and Dave Merrill, Bloomberg, 4/21/2020; Federal Reserve Bank of St. Louis, as of 4/22/2020.
[iv] Source: Office of Management and Budget, as of 4/22/2020. The “debt” in the numerator is federal debt held by the public, which excludes debt owed between various federal agencies.
[v] See note i.
[vi] See note i.
[vii] Source: Federal Reserve Bank of St. Louis, as of 4/22/2020. Annual federal deficit, 2009 – 2015.
[viii] Source: TreasuryDirect, as of 4/24/2020. Interest rate on a 10-year US Treasury note auctioned on 5/12/2010.
[ix] Ibid. 10-year US Treasury yield (constant maturity), 4/23/2020.
[x] See note iv.
[xi] See note iv.
[xii] Source: US Department of the Treasury, as of 4/23/2020. Weighted average maturity of marketable debt outstanding, 12/31/2019.
If you would like to contact the editors responsible for this article, please message MarketMinder directly.
*The content contained in this article represents only the opinions and viewpoints of the Fisher Investments editorial staff.
Get a weekly roundup of our market insights
Sign up for our weekly e-mail newsletter.

You Imagine Your Future. We Help You Get There.
Are you ready to start your journey to a better financial future?

Where Might the Market Go Next?
Confidently tackle the market’s ups and downs with independent research and analysis that tells you where we think stocks are headed—and why.
Related Resources
-
Market Analysis On the Iran Flare Up2026-07-08
-
Expert Commentary 3 Things You Need to Know This Week | Midterm Miracle, US Jobs, Tax Planning
 2026-07-07
 -
Weekly Wrap-Up Fisher Investments Reviews: Last Week in Markets—June 29 - July 32026-07-07
-
Market Analysis Can Germany Engineer Faster Growth at Last?2026-07-07


Learn More
Learn why 210,000 clients trust us to manage their money and how Fisher Investments and its affiliates may be able to help you achieve your financial goals.
As of 6/30/2026
New to Fisher? Call Us.
Contact Us Today