Personal Wealth Management / Economics
What to Make of April’s Disappointing Jobs Numbers
The April jobs report disappointed, but many are overlooking what labor data do—and don’t—show.

What do Atari’s E.T. the Extra-Terrestrial video game, the movie Waterworld and April’s US jobs report have in common? All were considered huge busts. One analyst called the Bureau of Labor Statistics’ (BLS) latest release the “most disappointing jobs report of all time.”[i] Now, we think that takes it a bit far. But even so, employment numbers are late-lagging indicators. Economic growth drives employment, not the other way around—and stocks pre-price all of it, in our view.
April jobs numbers disappointed pundits on myriad fronts. Nonfarm payrolls rose 266,000, far short of expectations for nearly 1 million.[ii] Besides that big miss, the BLS revised March’s gains down to 770,000 from 916,000.[iii] The unemployment rate ticked up from 6.0% to 6.1%—and some worried this understated reality since many dropped out of the labor force in the past year.[iv] While a fair concern, that seemingly ignores the existence of the U-6 unemployment rate, which tracks those who are neither currently working nor looking for work but indicate they want and are available for a job (the April U-6 rate dipped to 10.4% from March’s 10.7%).[v] Now, this of course excludes people forced out of work by childcare responsibilities during the pandemic, but in our view, that is a sociological issue—outside the sphere of markets. (That goes for other factors potentially keeping people from seeking jobs, including the supplemental federal unemployment benefits.)
While we don’t think any of this is predictive, it is worth putting April’s report in context—especially since the surrounding discussion has read a lot into one month of data. Despite the dour tone, this was still a positive read, and a 266,000 gain would be big for a “normal” month. Monthly noise is also normal, and seasonal or short-term factors may explain declines in certain industries. For example, within the professional and business services sector, temporary employment fell by -111,000—yet some of those losses likely reflect workers getting full-time positions.[vi] Manufacturing employment dropped by -18,000, but the weakness was primarily in motor vehicles, as semiconductor chip shortages have idled factories.[vii]
Also, contrary to what many seemed to expect, economic reopenings don’t mean businesses will hire en masse right away. Individual states’ plans differ—though Texas lifted its restrictions in March, California currently targets mid-June to reopen fully. New York City? July 1. With vaccinations still ongoing, not all businesses will return to full capacity immediately even when they are allowed to reopen. Many rollout plans will likely be slow and measured, especially since renewed COVID restrictions during last fall and winter are still a fresh memory.
However, April’s numbers seemed to signal a setback to those who use jobs to gauge the pace of the economic recovery. Total employment remains 8.2 million below its pre-pandemic level, and with the jobs growth rate appearing to slow, some fear the anticipated recovery boom may not manifest. One outlet estimated that at April’s growth rate, jobs won’t return to their pre-pandemic levels until the end of 2023.[viii] Whether or not that happens, the broader economic recovery won’t stall out if jobs don’t grow at a certain pace. Labor data are late-lagging economic indicators. Hiring reflects companies’ decisions to invest in new workers based on months-old assessment of recent economic results. Said another way, jobs confirm economic growth—they don’t drive it.
Take the prior economic expansion, which began in June 2009. Nonfarm payrolls contracted in six of the recovery’s first seven months. Even a year into the recovery—and following a strong May 2010 gain—nonfarm payrolls registered four straight negative months. These monthly dips and weak stretches didn’t truncate the young expansion. (Exhibit 1)
Exhibit 1: Monthly Change in Nonfarm Payrolls, June 2009 – June 2011
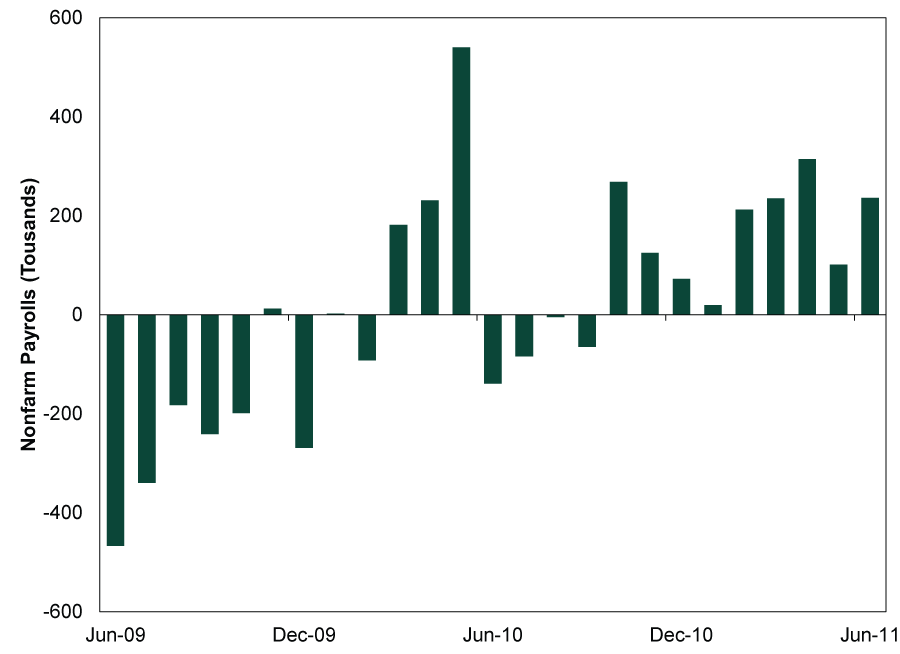
Source: FactSet, as of 5/10/2021. Nonfarm payrolls, monthly change, June 2009 – June 2011.
It was a similar story following 2001’s recession. (Exhibit 2) Nonfarm payrolls fell for six straight months after the recovery began, and monthly declines peppered the next year and a half. Those job losses didn’t prevent broader economic growth.
Exhibit 2: Monthly Change in Nonfarm Payrolls, November 2001 – November 2003
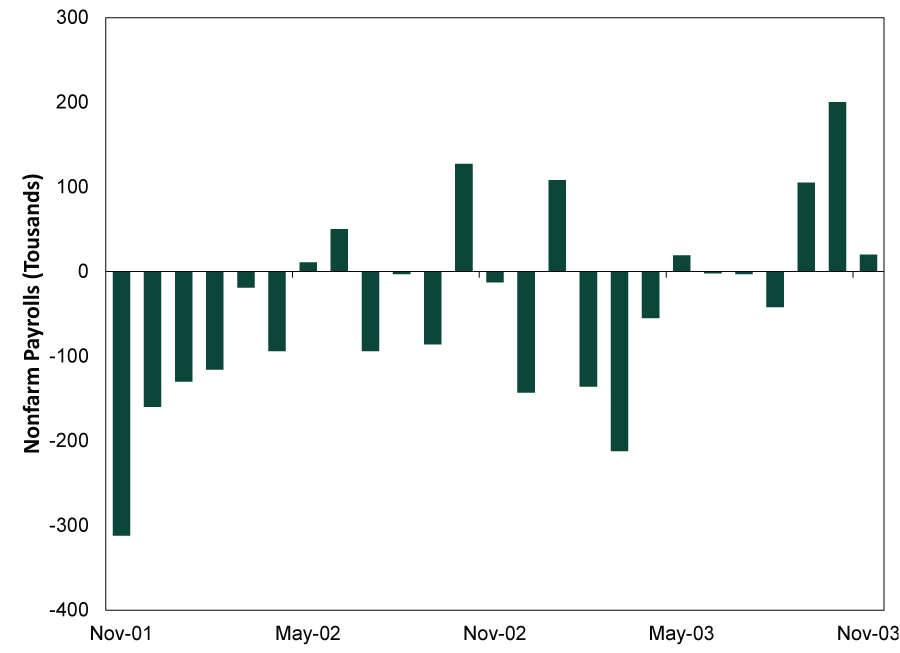
Source: FactSet, as of 5/10/2021. Nonfarm payrolls, monthly change, November 2001 – November 2003.
We don’t think this time is different. Labor data can be volatile, and no single monthly reading means the recovery is in trouble (or strengthening, for that matter). However, today’s high expectations—and the resulting widespread disappointment—speaks to where sentiment is now. We think it is rational to expect some pop in the economic data related to reopenings, but those bursts will likely soon give way to pre-COVID trends. In our view, the reaction to April’s jobs report can be a useful baseline for reactions to other widely watched datasets in the coming months as investors gauge how expectations align with reality.
[i] 'This Might Be the Most Disappointing Jobs Report of All Time': Analyst,” Ethan Wolff-Mann, Yahoo! Finance, 5/7/2021.
[ii] Source: Bureau of Labor Statistics, as of 5/7/2021.
[iii] Ibid.
[iv] Ibid.
[v] Ibid.
[vi] Ibid.
[vii] Ibid.
[viii] “U.S. Picked Up Just 266,000 jobs in April, Well Below Expectations as Economy Struggles to Rebound,” Eli Rosenberg, The Washington Post, 5/7/2021.
If you would like to contact the editors responsible for this article, please message MarketMinder directly.
*The content contained in this article represents only the opinions and viewpoints of the Fisher Investments editorial staff.
Get a weekly roundup of our market insights
Sign up for our weekly e-mail newsletter.

You Imagine Your Future. We Help You Get There.
Are you ready to start your journey to a better financial future?

Where Might the Market Go Next?
Confidently tackle the market’s ups and downs with independent research and analysis that tells you where we think stocks are headed—and why.
Related Resources
-
In The News Oil prices will be lower in 6 months than when Iran conflict began, Ken Fisher argues2026-03-12
-
Market Analysis Rounding Up Odds and Ends From Global Energy Developments2026-03-11
-
Environmental, Social and Governance Insights Responsible Investment Newsletter 20262026-03-11
-
Economics Pain at the Pump Won’t Hurt the Global Economy2026-03-10


Learn More
Learn why 195,000 clients trust us to manage their money and how Fisher Investments and its affiliates may be able to help you achieve your financial goals.
As of 12/31/2025
New to Fisher? Call Us.
Contact Us Today