Personal Wealth Management / Market Volatility
Putting Stock Market Volatility In Historic Perspective

Think back to the last time stock market volatility was in the news. Talking heads likely mentioned the VIX or CBOE Volatility Index and sounded the alarm bells. This sensationalism can be frightening in the moment, but volatility is an inescapable feature of stock markets. For investors who need stock-like growth to reach their long-term financial goals, short-term volatility is often the price they must pay to achieve them. In our view, fixating on stocks’ short-term movements or measures like the VIX can be counterproductive for long-term investors. No one can avoid all negative stock market volatility, and attempting to can be hazardous to your longer-term financial health.
In the moment, volatility can seem unique and worse than it’s ever been before. But is that true? A look at historical stock prices can help put recent volatility in perspective. The accompanying chart plots the S&P 500 Price Index in logarithmic scale to help you see historical volatility (logarithmic scale plots percentage moves equally). The red and yellow dots denote daily moves greater than -2% and -1%, respectively. The light and dark green bars show the numbers of days per year with moves greater than -2% and +2%, respectively.
Market Volatility in Perspective
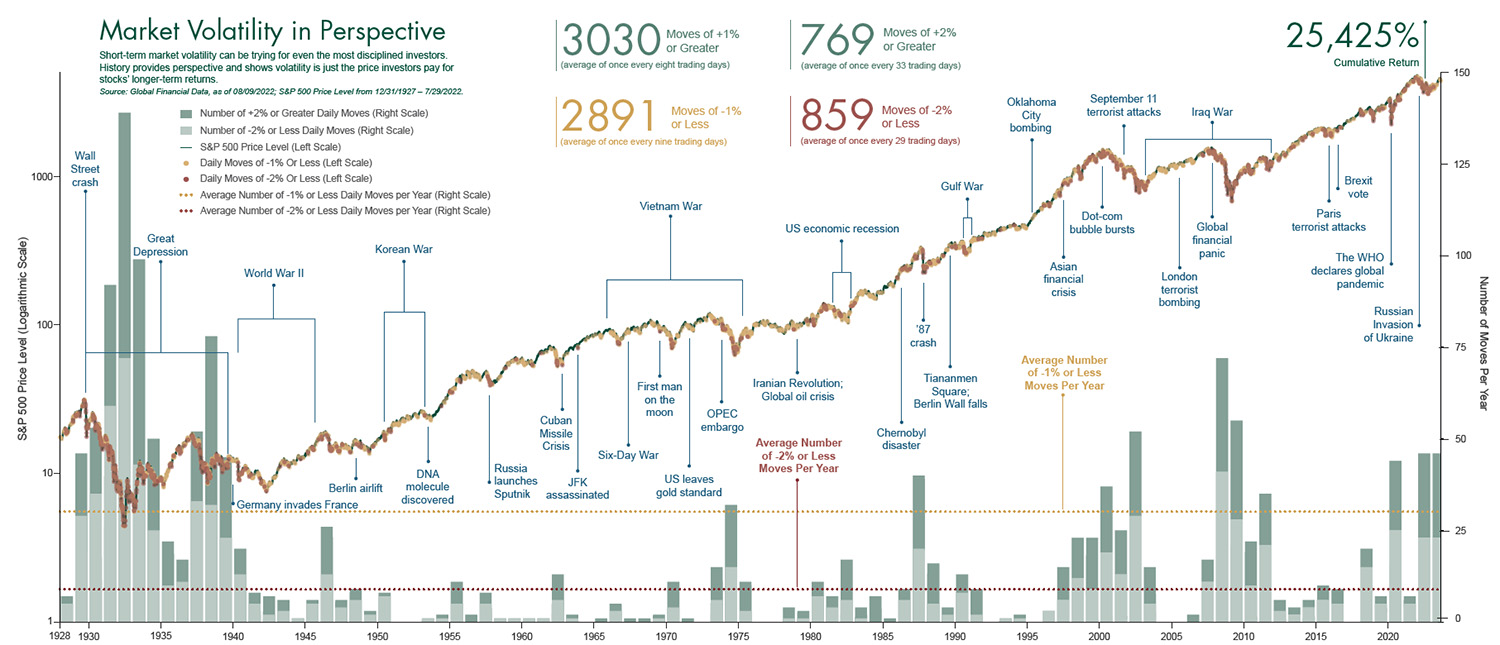
From January 1928 through August 2023, the S&P 500 Index fell more than 1% in a single day 2,891 times, or every 9 trading days on average, yet rose by more than 1% in 3,030 trading days. Over that same period, the index fell more than 2% 859 times, but rose by more than 2% 769 times—both every 30 trading days on average. Still, over this seemingly volatile period, the S&P 500 rose more than 25,425% cumulatively. A hypothetical investment of $10,000 in 1928 would have grown to $2,552,469 by August 2023—not counting dividends.
Despite experiencing seemingly frequent bouts of short-term volatility, stocks have provided generally strong long-term returns. Stocks’ long-term growth is the reward for taking on their short-term volatility. However, many investors fail to achieve stocks’ long-term market returns due to their own reactions to downside volatility.
Investors often stand in their own way
People tend to hate their losses much more than they appreciate their gains—a behavioral phenomenon called myopic loss aversion. This human tendency may contribute to media sensationalism around the VIX and other volatility measures when markets are falling. Fear-based headlines are more likely to grab viewers’ attention and entice them to tune in! However, periods of heightened volatility often fool investors into trading in and out of the market at the wrong times. When the market tanks, myopic loss aversion tempts them to sell stocks and “cut their losses.” However, doing so may cause investors to sell stocks low, just before the market rebounds—dinging them on the way down and the way back up.
If you attempt to sidestep implied volatility (expected future fluctuations) by trading in and out of the market, you may incur transaction costs and risk missing out on positive volatility if stocks rise. For example, 2008 featured extremely negative returns and a standard deviation (a common measure of volatility) of 20.1%.i Then, in 2009, the market was extremely positive and sported a standard deviation of 21.3%—just topping 2008’s.ii Though folks often associate volatility with negative returns, volatility can be positive too. That upside volatility is a key reason equities have been able to deliver a relatively high average annualized return over the long-term.
Historical volatility doesn’t predict
One common investing disclosure is “past performance doesn’t indicate future results,” which applies for market returns as well as volatility. Standard deviation (or volatility) of the last month, year or decade is inherently backward-looking and can't tell you anything about the future. However, analyzing market return and volatility data over historical periods may help you set expectations for risk and return characteristics of different asset classes. Those averages can be helpful for planning, but they won’t tell you exactly what will happen in the future—just the probabilities of different outcomes.
To be a successful investor, it helps to take a longer-term perspective on market volatility and resist the urge to react to short-term swings. Previous fluctuations may have been tough on your psyche, but trading because you’ve just experienced downside volatility can open you up to new risks that could set you back on the journey to accomplishing your financial goals. If you find stocks’ ups and downs difficult to weather, you may benefit from working with a dedicated investment adviser who knows you personally and can provide much needed counsel when markets get rocky.
i Source: Global Financial Data, Inc., as of 12/31/2018. S&P 500 Total Return Index from 12/31/2007 to 12/31/2008 and from 12/31/2008 to 12/31/2009.
ii Ibid.

Where Might the Market Go Next?
Confidently tackle the market’s ups and downs with independent research and analysis that tells you where we think stocks are headed—and why.
Insights & Media
-
Market Analysis Why “War Winner” Trades Are Off Base2026-03-20
-
Expert Commentary This Week in Review | Energy Markets, Fed Meeting, Earnings Reporting
 2026-03-20
 -
Market Analysis Around the World in Central Banking, Iran War Edition2026-03-19
-
Politics Beyond the War: A Political Roundup Covering America, Canada and Denmark2026-03-17


Learn More
Learn why 195,000 clients trust us to manage their money and how Fisher Investments and its affiliates may be able to help you achieve your financial goals.
As of 12/31/2025
New to Fisher? Call Us.
Contact Us Today