Personal Wealth Management / Economics
An Update on the US Yield Curve
Another inversion, another look at banks’ interest rates.

It is happening again. After the yield curve flirted with inversion in early February, last week’s broad fears over the coronavirus took 10-year yields back near historic lows—sending the gap between long and short-term interest rates further into negative territory. Accordingly, we are seeing a fresh round of articles warning the inverted curve is troubling for the US economy. Few, if any, bother mentioning that short-term volatility is normal for bonds as well as stocks. The curve’s near-term wiggles are impossible to predict, and it could be back in positive territory relatively soon—or not. Regardless, we thought it would be beneficial to explore how the lending landscape has evolved since the curve’s mid-2019 inversion so you can see why we don’t think this latest dip is a warning sign of imminent danger.
To catch everyone up, Exhibit 1 shows the spread between 10-year and 3-month Treasury yields since the beginning of last year.
Exhibit 1: The Yield Curve Spread’s Recent History
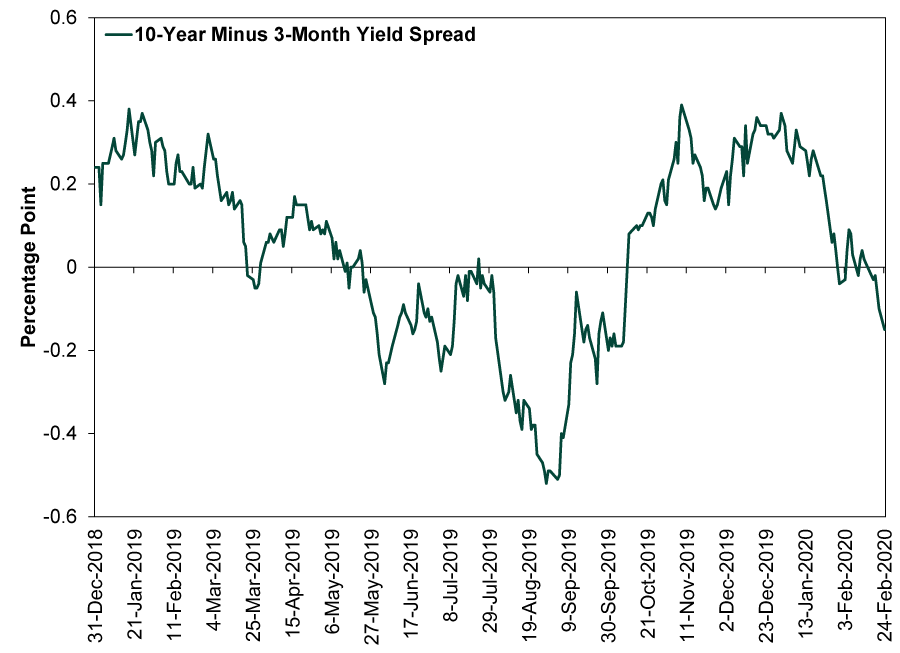
Source: FactSet, as of 2/25/2020. 10-year and 3-month constant maturity US Treasury yields, 12/31/2018 – 2/24/2020.
The popular yield curve narrative states inversion is trouble because it signals economic pessimism, supposedly a self-fulfilling prophecy. We take a less metaphysical view. We think—and data back this up—that the yield curve matters because it is a reference point for banks’ profit margins. Banks borrow at short-term interest rates and lend at long-term rates. Their profit is the difference between the two, aka their net interest margin (NIM). Now, the relationship between banks’ rates and government rates isn’t airtight, because market rates ultimately depend on supply and demand. Therefore, an inverted yield curve—where short rates exceed long rates—is but the first warning sign that banks’ profits may eventually vanish. It isn’t a timing tool, especially when the inversion is shallow.
Therefore, we think it is most useful to look at banks’ actual deposit and lending rates. We did this last May, and what follows are updated versions of all the charts we ran then. Spoiler alert: Little has changed—things still look fine.
Exhibit 2 shows a smattering of average deposit rates as well as their government reference points. The rates on offer remain far lower than the government benchmarks, which makes sense considering deposits remain plentiful. If there is a glut of deposits, banks can get away with paying lower rates to all of us—with funds sloshing around, they don’t have to compete. It is annoying, but it also helps insulate the economy from an inverted yield curve. It also explains why deposit rates haven’t dropped alongside the 3-month and effective fed-funds rates. Supply swamped all other variables.
Exhibit 2: An Updated Smorgasbord of Short-Term Bank Funding Costs Vs. Their Benchmarks

Source: Federal Reserve Bank of St. Louis and FactSet, as of 2/25/2020. National rates on non-jumbo checkable deposits, non-jumbo savings accounts, non-jumbo 3-month CDs and non-jumbo money market deposits, and constant-maturity 3-month and effective fed-funds rates on 2/24/2020.
Loan rates have come down a bit, as Exhibit 3 shows. We don’t find this surprising, either, as they have generally been more sensitive to long-term government yields’ movements in recent years. Plus, with no signs of runaway inflation, banks don’t need to jack up rates to preserve profits longer-term. They can cut rates a little in order to win business. That is particularly the case when corporate bonds yields are low, providing banks with some competition in the corporate lending game. Importantly, however, loan rates are still comfortably above benchmarks and deposit rates.
Exhibit 3: An Updated Look at Key Bank Loan Rates Vs. Their Benchmarks
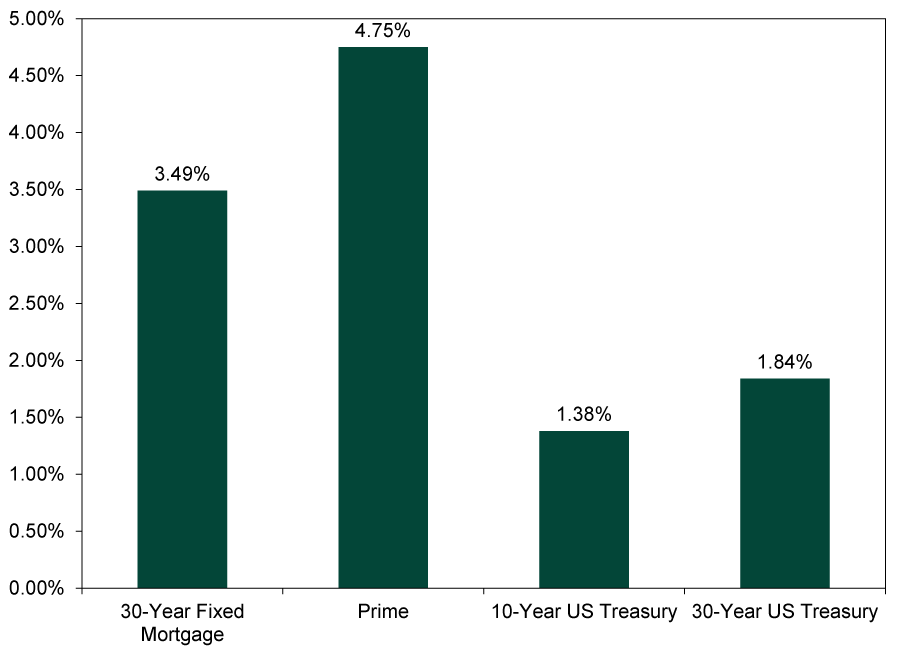
Source: St. Louis Federal Reserve and FactSet, as of 2/25/2020. National average 30-year fixed mortgage rate on 2/20/2020, national average prime rate on 2/21/2020 and constant maturity 10-year and 30-year US Treasury yields on 2/24/2020.
As a result, NIMs haven’t much budged from where they were last spring. The FDIC releases this information quarterly, and lucky for us, they issued Q4 2019 data a few days ago. As Exhibit 4 shows, the average NIM then was 3.31%, down just a hair from Q2 2019’s 3.37%. Yah, but the yield curve was positive last quarter, you might rightfully point out. Yet Q4’s figure is still significant because monetary policy changes—including yield curve shifts—tend to hit the real economy at a lag. So Q4(ish) is right around where we would expect a summertime inversion to start showing up in banks’ margins. That the effect was so tiny tells you all you need to know, in our view. Plus, NIMs were lower than this earlier in this economic expansion, and it didn’t derail growth.
Exhibit 4: Banks’ Net Interest Margins Are Still Holding Steady
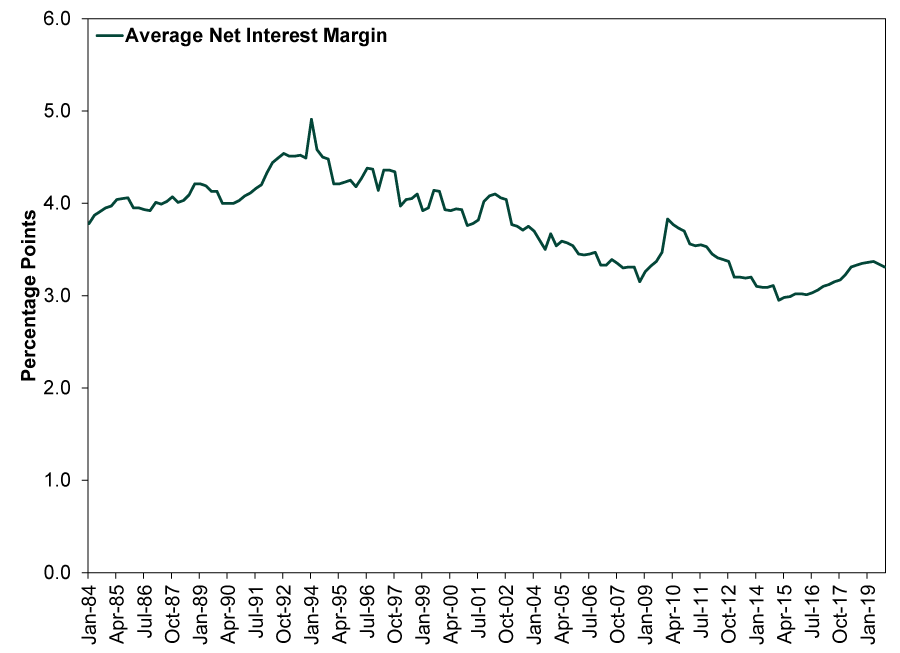
Source: Federal Reserve Bank of St. Louis, as of 2/24/2020. Average net interest margin for all US banks, quarterly, Q1 1984 – Q4 2019.
Lastly, we should point out that last year’s inversion didn’t derail stocks or the US economy. The bull market continued. GDP kept growing. Lending didn’t dry up. In our view, it would take a much deeper, longer and global inversion to knock things off course. We still live in a world where banks can borrow even more cheaply overseas, where negative interest rates still reign, and lend for fatter profits at home. As long as this interest rate arbitrage persists—and as long as banks’ actual margins stay healthy—a small domestic yield curve inversion shouldn’t matter.
If you would like to contact the editors responsible for this article, please message MarketMinder directly.
*The content contained in this article represents only the opinions and viewpoints of the Fisher Investments editorial staff.
Get a weekly roundup of our market insights
Sign up for our weekly e-mail newsletter.

You Imagine Your Future. We Help You Get There.
Are you ready to start your journey to a better financial future?

Where Might the Market Go Next?
Confidently tackle the market’s ups and downs with independent research and analysis that tells you where we think stocks are headed—and why.
Related Resources
-
Expert Commentary Why Ken Fisher Is Optimistic About European Stocks
 2026-07-23
 -
Economics A Summertime Check-in on US Consumers2026-07-23
-
Politics Blunting Burnham?2026-07-21
-
Market Analysis Why the SOX “Bear Market” Isn’t Foreboding2026-07-21


Learn More
Learn why 210,000 clients trust us to manage their money and how Fisher Investments and its affiliates may be able to help you achieve your financial goals.
As of 6/30/2026
New to Fisher? Call Us.
Contact Us Today