Personal Wealth Management / Market Analysis
Reviewing the Latest Data Out of America, China and Japan
A peek at how the world’s largest economies have fared recently.

As stocks finished a frustrating Q3 last Friday, America, China and Japan released some widely followed economic data. While the figures are backward-looking, they show ongoing resilience in the world’s three largest economies—evidence reality has held up better against myriad headwinds than many seemingly expected.
Resilient US Consumer Spending
First up: US personal consumption expenditures (PCE). This inflation-adjusted consumer spending measure includes goods and services—a contrast to the retail sales report, which isn’t inflation-adjusted and omits most services spending.
August real PCE rose 0.1% m/m after July’s -0.1% dip, and the numbers were in line with 2022’s spending trends: stabilizing services, weaker goods.[i] (Exhibit 1) The latter fell -0.2% m/m, its fifth drop in the past eight months, while the former climbed 0.3%—its seventh straight rise.
Exhibit 1: US PCE, August 2021 – August 2022
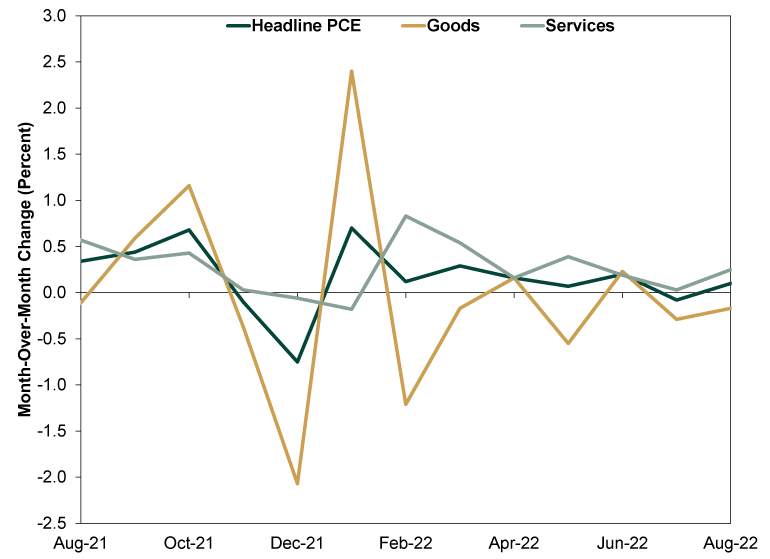
Source: FactSet, as of 10/3/2022.
The report also includes PCE inflation, and the headline number—the Fed’s targeted metric—decelerated in August to 6.2% y/y from July’s 6.4%.[ii] However, most coverage focused on core PCE (which excludes volatile energy and food prices) accelerating from 4.7% to 4.9%. Fair enough, though in the context of 2022, core PCE has still slowed from February’s 5.4% y/y rate.[iii]
Most analysis seemed pessimistic about consumers’ ability to continue spending amid elevated prices. The concern is logical in theory, but we don’t think it holds in practice since most consumer spending doesn’t fluctuate much—what economists call “inelastic demand.” Consider: Households typically won’t cut most essential services spending (e.g., housing and health care) regardless of economic conditions. However, they may adjust during tougher times, possibly pulling back on forms of discretionary spending or shifting to cheaper goods.
The data suggest this may be happening, as select discretionary goods categories have weakened this year. Spending in the “jewelry & watches” category has contracted in five of the past six months, and some recreational goods spending—including on musical instruments, gardening items and film and photographic supplies—has softened, too.[iv] Yet services expenditures have remained growthy amid elevated inflation. We don’t dismiss people’s economic pain—and sacrifice—as they alter habits in response to higher prices. But elevated prices haven’t upended PCE, which comprises about 70% of US GDP, at least thus far.
Mixed Chinese September PMIs
September’s purchasing managers’ indexes (PMIs) out of China were mixed. The government’s official manufacturing PMI rose to 50.1 from August’s 49.4—perhaps reflecting a boost from policymakers’ stimulus measures. (Readings above 50 imply broad expansion while below 50 suggest contraction.) However, the non-manufacturing PMI (which includes services, real estate and construction) fell to 50.6 from August’s 52.6, with services dipping to 48.9 from August’s 51.9.[v] The Caixin September China PMIs, which reflect more small, private firms, were also mixed: Manufacturing slipped to 48.1 from August’s 49.5 while services hit 55.0 after August’s 55.5.[vi]
The big headwind facing the manufacturing and services sectors remains the government’s “zero-COVID” policy. As Caixin’s September manufacturing report noted, unstable business expectations is an issue, as uncertainty around COVID policy has discouraged hiring—prompting multinationals to explore other locales to source their goods (e.g., Vietnam or India).
While PMIs are a timely snapshot of recent economic conditions, they reveal only the breadth, not magnitude, of growth or contraction. Sub-50 PMIs also don’t automatically mean contracting GDP—they may just point to slowing economic growth. Output data (e.g., retail sales and industrial production) will provide more concrete details. Those have slowed lately, but it is worth remembering: Even tepid Chinese growth still contributes meaningfully to global GDP. Moreover, we don’t think it is realistic to expect an economy as big as China’s to expand at a perpetually super-fast rate—especially when most big gains for a developing economy from activities like infrastructure spending are over.
Japan: A Bright Spot
In the Land of the Rising Sun, August industrial production rose for a third straight month (2.7% m/m) thanks to a boost in production machinery, offsetting a slump in electronic parts & devices and motor vehicle production.[vii] August retail sales rose for the sixth month in a row, climbing 4.1% y/y (1.4% m/m) and accelerating from July’s 2.4% y/y.[viii] Higher retail sales is due partly to fuel sales, which likely reflects some higher energy costs. But growth wasn’t solely from energy, as sales also rose for general merchandise and fabrics apparel and accessories.
Alongside August output data, PMIs suggest a majority of businesses grew in September. Manufacturing hit 50.8 as some businesses reported signs of easing supply constraints, while services registered 52.2 thanks to looser COVID restrictions lifting demand.[ix] Moreover, Japan’s composite PMI, which aggregates manufacturing and services output, was 51.0—better than the US, UK and eurozone’s September composite PMIs.[x] Japan has benefited from reopening-related tailwinds, with more likely to come in October as the country reopens fully to foreign tourists. This is probably a short-lived boost, as we have seen with other reopening economies, and one that doesn’t fundamentally improve the country’s longer-term economic issues (e.g., tepid domestic demand, bizarre monetary policy). But considering all the focus on today’s global economic weak spots, we think recognizing the resilience of the world’s biggest economies can help investors weigh how reality stacks up with pretty dour expectations.
If you would like to contact the editors responsible for this article, please message MarketMinder directly.
*The content contained in this article represents only the opinions and viewpoints of the Fisher Investments editorial staff.
Get a weekly roundup of our market insights
Sign up for our weekly e-mail newsletter.

You Imagine Your Future. We Help You Get There.
Are you ready to start your journey to a better financial future?

Where Might the Market Go Next?
Confidently tackle the market’s ups and downs with independent research and analysis that tells you where we think stocks are headed—and why.
Related Resources
-
Politics Beyond the War: A Political Roundup Covering America, Canada and Denmark2026-03-17
-
Economics Doubts Aplenty After UK January GDP Flatlined2026-03-17
-
Expert Commentary 3 Things You Need to Know This Week | Fed Meeting, Central Banks, Defense Spending
 2026-03-16
 -
Economics US Data Stronger Under the Hood Than Many Realize2026-03-16


Learn More
Learn why 195,000 clients trust us to manage their money and how Fisher Investments and its affiliates may be able to help you achieve your financial goals.
As of 12/31/2025
New to Fisher? Call Us.
Contact Us Today