Personal Wealth Management / Market Analysis
What to Make of January’s LEI Surprise
A look under the hood suggests the gauge’s big monthly jump doesn’t portend rapid US growth ahead.

Among the myriad economic gauges and statistics out there, we think The Conference Board’s Leading Economic Index (LEI) stands out as one worth following. It is broad-based, mashing together 10 data points into a single figure. It is also a useful forward-looking indicator, given it has telegraphed every US recession since 1959. Hence, January’s 0.8% m/m rise—the largest since October 2017 and double expectations—seemingly bodes great for US growth.[i] Yet we think it primarily showcases the gauge’s calculation quirks and doesn’t necessarily mean a huge growth acceleration awaits.
Despite LEI’s history of accuracy, it isn’t a perfect economic forecasting tool. Over the years, it has given a fair few false signals—short-lived declines that didn’t precede an economic downturn. To separate potentially meaningful moves from noise, we recommend analyzing LEI’s components to see what produced a given result. Doing so last autumn led us to believe manufacturing weakness drove LEI’s decline—not an indication of broad economic weakness, as factory output accounts for just 11.5% of US GDP.[ii]
This time around, as Exhibit 1 shows, just one LEI component detracted.
Exhibit 1: January LEI Component Contributions
Source: FactSet, as of 2/21/20. LEI components’ contributions, January 2020. Note: The sum of contributions doesn’t equal the monthly percentage change due to rounding.
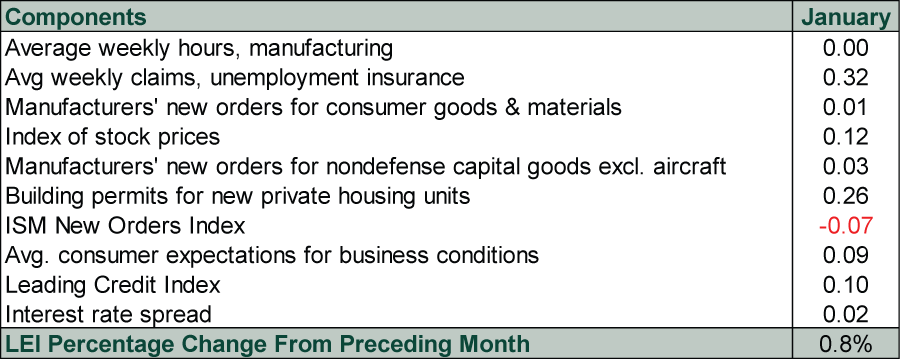
Most of the upside came from three contributors: average weekly jobless claims, building permits and stock prices. These collectively contributed 0.7 percentage point of the gauge’s month-over-month rise. However, they aren’t LEI’s most meaningful inputs. First, unemployment insurance claims are a snapshot of labor market conditions, which lag the economy. Firms typically boost layoffs in response to difficulties that have persisted for a while, not because things are fine but might get worse. Second, while building permits presage housing construction and its associated economic activity, residential real estate represents just 3.8% of US GDP.[iii] Even large monthly fluctuations aren’t very significant.
Finally, stock prices do price in future economic conditions. But it is a little odd for equity investors to latch onto them as a reason for optimism, considering past performance never predicts. Further, stocks can be noisy in the short term. Monthly wiggles aren’t telling about future economic conditions. Cyclical shifts (bull to bear or bear to bull) historically have predicted shifting economic tides, but one month doesn’t even hint at that. Hence, while stocks can help forecast the economy to an extent, we think investors should discount this signal. Moreover, stock prices’ positive contribution to January’s LEI is strange considering the S&P 500 fell -0.2% in price terms during the month.[iv] The reason for the mismatch: LEI compares each month’s average daily S&P 500 closing price to the previous month’s. Since January’s average was higher than December’s, LEI registered an increase—even though the index fell in the month when comparing beginning and ending levels.
Other LEI components throw cold water on the notion a major upswing looms. Its more forward-looking inputs—the Leading Credit Index, the interest rate spread and manufacturers’ new orders—didn’t shine as brightly in January. Not that they signaled distress: The former two both contributed positively, suggesting credit conditions are fine presently. The Leading Credit Index has risen for 22 straight months, reflecting an overall healthy lending environment that helps support the economic expansion. Manufacturing new orders’ detraction, meanwhile, was another calculation quirk. The gauge actually registered modest expansion in January, rising from 47.6 to 52.0.[v] Readings above 50 mean more than half of surveyed manufacturers reported more new orders. But LEI compares monthly survey readings to the series’ (higher) long-term average. Hence, an expansionary read can still detract from LEI.
While we don’t think LEI is signaling a huge upswing, this isn’t reason for disappointment. We never expected the mid-cycle slowdown to give way to surging GDP growth—just more of the same middling growth rates that have characterized the bulk of this expansion. Stocks don’t need rip-roaring growth. What matters is the gap between reality and expectations. Sentiment is still in check, with few expecting even a modest economic uptick. Even middling growth should keep beating tepid expectations, extending this bull market’s economic underpinnings.
[i] Source: The Conference Board, as of 2/21/2020.
[ii] Source: FactSet, as of 2/24/2020. Manufacturing output as a percentage of GDP, Q3 2019.
[iii] Source: Federal Reserve Bank of St. Louis, as of 2/21/2020. Private residential fixed investment as a percentage of GDP, Q4 2019.
[iv] Source: FactSet, as of 2/21/20. S&P 500 Price Index, 12/31/2019 – 1/31/2020.
[v] Source: Institute for Supply Management, as of 2/20/2020.
If you would like to contact the editors responsible for this article, please message MarketMinder directly.
*The content contained in this article represents only the opinions and viewpoints of the Fisher Investments editorial staff.
Get a weekly roundup of our market insights
Sign up for our weekly e-mail newsletter.

You Imagine Your Future. We Help You Get There.
Are you ready to start your journey to a better financial future?

Where Might the Market Go Next?
Confidently tackle the market’s ups and downs with independent research and analysis that tells you where we think stocks are headed—and why.
Related Resources
-
Market Analysis Why “War Winner” Trades Are Off Base2026-03-20
-
Expert Commentary This Week in Review | Energy Markets, Fed Meeting, Earnings Reporting
 2026-03-20
 -
Market Analysis Around the World in Central Banking, Iran War Edition2026-03-19
-
Politics Beyond the War: A Political Roundup Covering America, Canada and Denmark2026-03-17


Learn More
Learn why 195,000 clients trust us to manage their money and how Fisher Investments and its affiliates may be able to help you achieve your financial goals.
As of 12/31/2025
New to Fisher? Call Us.
Contact Us Today