Personal Wealth Management / Economics
Why Fed People Keep Missing the Target
Low inflation needn’t be a mystery.

Seven years ago, the Fed followed many global central banks and installed an inflation target—2.0% y/y, as measured by the headline Personal Consumption Expenditures (PCE) price index. Since then, their aim has proven … lacking. PCE inflation has met or exceeded 2.0% in only 12 of 87 months.[i] Cue the consternation. With unemployment at 50-year lows, Fed officials and watchers seem perplexed by cool inflation, leading the Fed to review targeting earlier this month. In our view, this vastly overrates the link between unemployment and inflation, particularly given the flimsy historical evidence. The Fed isn’t missing its inflation target because anything is broken, as some headlines suggest—this isn’t a symptom of a deeper economic risk investors need to be concerned about. Rather, we think the central bank—and monetary policy—would benefit from updated thinking and better economic theory.
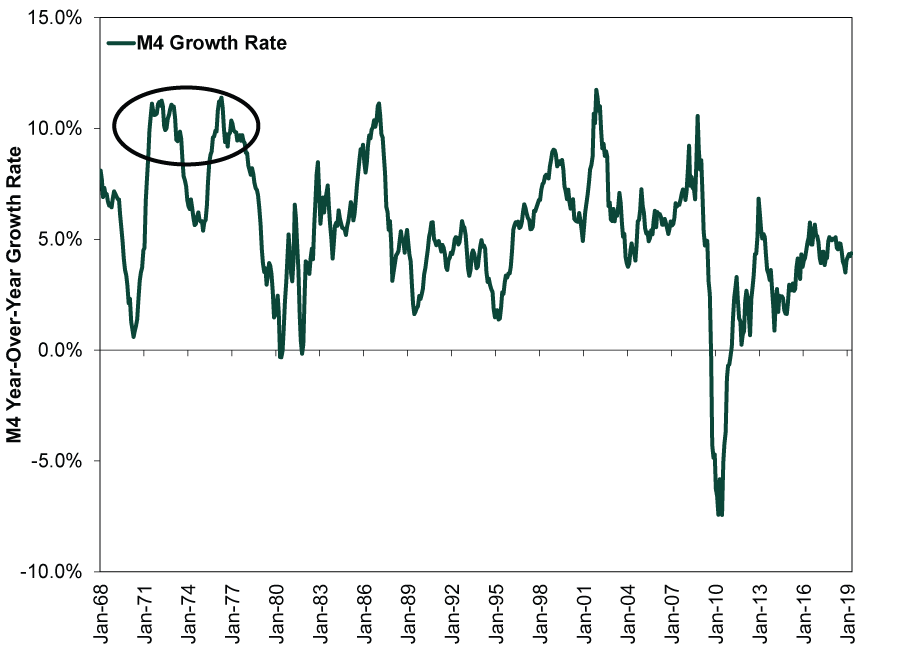
Fed officials and watchers seemingly base their view on the Phillips Curve, a theory suggesting low unemployment drives wage growth and ultimately inflation. It inspired 1978’s Humphrey-Hawkins Act, which gave the Fed its dual mandate targeting maximum employment with price stability. It is ingrained Fed orthodoxy. But it shouldn’t be, in our view. Humphrey-Hawkins wrongly presumed 1970s inflation was a wage-price spiral. Policymakers apparently missed how expansionary monetary policy fueled sky-high money supply growth—a key inflation component—throughout the 1970s. M4 money supply—the broadest measure—grew at an average monthly rate of 7.6% y/y from January 1970 through December 1979, well above the 5.5% average rate since data began in 1968.[ii] While this is obvious in hindsight, and Nobel Laureate Milton Friedman’s adage that inflation is always and everywhere a monetary phenomenon now has a wide following, it wasn’t conventional wisdom in 1978. “Monetary policy neglect” is now a term many economic historians use to describe the decade’s thinking.[iii]
Exhibit 1: Money Supply Growth Was Abnormally High in the 1970s
Source: Center for Financial Stability, as of 6/17/2019. Year-over-year growth rate of monthly US M4, January 1968 – April 2019.
Even in the realm of non-monetary inflation drivers—the “too few goods” part of the “too much money chasing too few goods” description—unemployment doesn’t factor. For one, it didn’t cause oil prices to nearly quintuple, from $3.56/barrel in January 1973 to $14.85 in January 1978, an honor that goes to OPEC’s 1973 oil embargo.[iv] Meanwhile, President Nixon’s wage and price controls, which ran from August 1971 until May 1974, further drove prices higher. The inflation rate rose from 6.1% when controls took effect to 10.7% when they ended.[v] As typically happens when governments enact price ceilings, they caused supply shortages and forced the administration to continually reset the ceiling at higher and higher levels. (A cautionary tale to those currently pitching rent control as a means to lower housing costs, in our view.) Once the controls ended, prices soared further still.
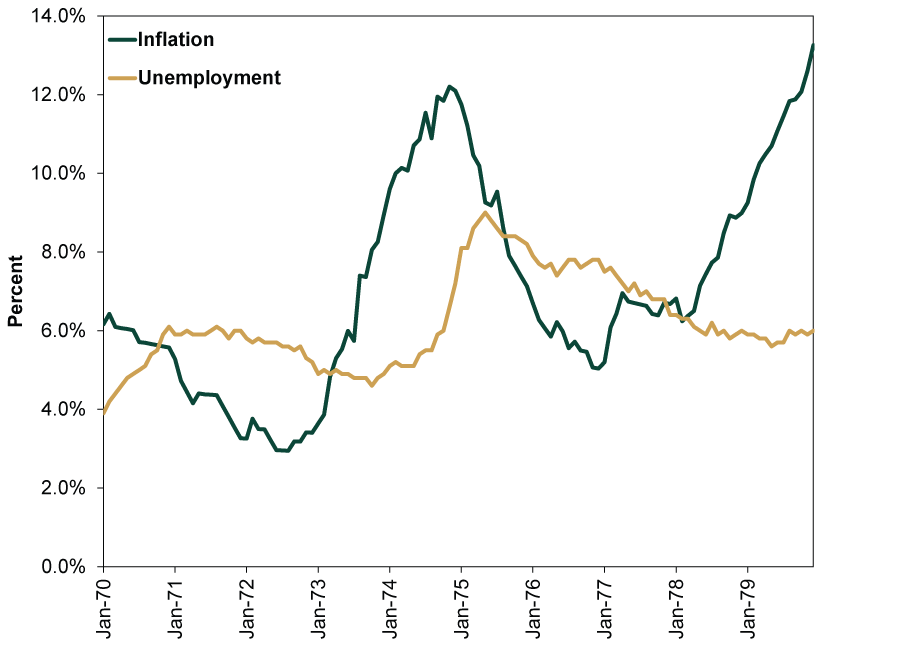
Ultimately, the Phillips Curve theory doesn’t hold up. Folks presume this chain reaction: Tight labor markets drive faster wage growth as employers pay more to compete for workers; firms pass on higher labor costs to consumers by raising prices, sparking inflation. But evidence supporting this notion is thin. For one, the aforementioned 1970s debunk it. Double-digit inflation came with sky-high unemployment.
Exhibit 2: High Inflation and Unemployment Debunk the Phillips Curve
Source: FactSet, as of 6/20/2019. Monthly unemployment rate (U3) and year-over-year percentage change in monthly Consumer Price Index, January 1970 – December 1979.
The 1990s are another counterpoint. Unemployment fell for most of the 1990s expansion, bottoming at 3.8% in April of 2000, but inflation remained fairly modest.[vi] As is well documented via today’s befuddlement, falling unemployment in the current expansion hasn’t stoked inflation either.
What the Fed seems to be missing is that wages don’t drive inflation. Rather, inflation drives wages. As Milton Friedman brilliantly explained, while competition for workers when unemployment is low can encourage companies to compete with higher wages, they do so with real—inflation-adjusted—wages. If they want to compete for the best employees, they must consider the cost of living to attract workers. If unemployment is low but inflation is barely there, nominal wages may not need to rise much to attract talent. Conversely, if unemployment and inflation are both high, you could end up with jumpy nominal wage growth even as real wages stagnate since companies don’t need to compete. Therefore, as we note here, to believe wages create inflation is essentially saying inflation creates inflation. If that were so, the 1970s nightmare would never have ended.
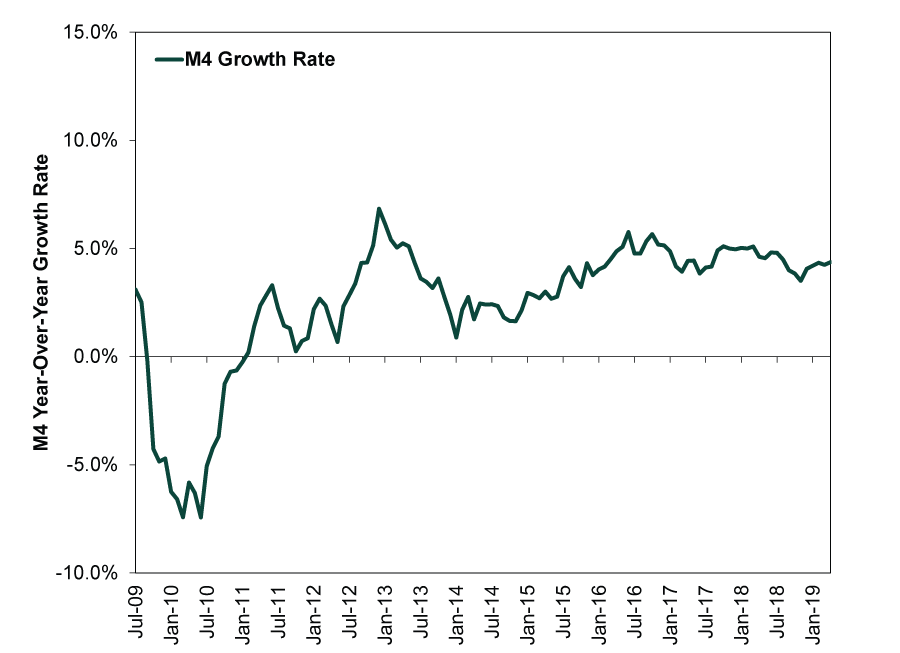
When you consider inflation as a monetary phenomenon, rather than a labor market phenomenon, today’s below-target inflation makes sense. M4 money supply growth has been modest for much of this economic cycle and was negative for a long stretch. The Fed is a major culprit for this, since its quantitative easing (QE) program weighed on lending by flattening the yield curve, which weighed on new lending’s profitability. Banks had more incentive to park money at the central bank for free than to lend enthusiastically. This saps money supply growth in a fractional reserve system, where bank lending drives most broad money supply. We suspect it is a reason why average loan growth during this cycle is below average loan growth during the prior three expansions.[vii] Money supply growth picked up when the Fed ended QE in 2014, but even now it is below the long-term average.
Exhibit 3: Modest Money Supply Growth Has Kept Inflation in Check
Source: Center for Financial Stability, as of 6/17/2019. Year-over-year growth rate of monthly US M4, July 2009 – April 2019.
In short, what is broken here isn’t the Fed’s target or the US economy. That inflation hasn’t reached its target isn’t a sign of permanent sclerosis or a broken financial system, as we have periodically seen headlines suggest. Rather, it lays bare the flaws inherent in both the Fed’s mandate and its members’ approach. If policymakers stopped viewing prices through a lens of unemployment and instead got back to basics, concentrating on money supply growth and the yield curve as they used to, we suspect it would lead them away from bizarre experiments like quantitative easing and balance sheet management as monetary policy tools with no history of success. In the meantime, understanding where the Fed’s thinking errs can help investors better assess whether a given policy move is an error stocks may have to reckon with.
[i] Source: Federal Reserve Bank of St. Louis, as of 6/20/2019. PCE price index, year-over-year percentage change, January 2012 – April 2019.
[ii] Source: Center for Financial Stability, as of 6/17/2019. Year-over-year growth rate of monthly US M4, January 1970 – December 1979 and January 1968 – April 2019.
[iii] Source: “The Great Inflation of the Seventies: What Really Happened?” Edward Nelson, Federal Reserve Bank of St. Louis Working Paper Series, January 2014.
[iv] Source: FactSet, as of 6/21/2019. End of month West Texas Intermediate Spot Crude Oil Price, January 1973 – January 1978.
[v] FactSet, as of 6/20/2019. Monthly Consumer Price Index, August 1971 – May 1974.
[vi] Source: FactSet, as of 6/7/2019. U3 unemployment rate, January 1990 – April 2000.
[vii] Source: FactSet, as of 6/21/2019. Average monthly loans and leases in bank credit for all commercial banks, November 1982 – July 1990, March 1991 – March 2001, November 2001 – December 2007 and June 2009 – May 2019.
If you would like to contact the editors responsible for this article, please message MarketMinder directly.
*The content contained in this article represents only the opinions and viewpoints of the Fisher Investments editorial staff.
Get a weekly roundup of our market insights
Sign up for our weekly e-mail newsletter.

You Imagine Your Future. We Help You Get There.
Are you ready to start your journey to a better financial future?

Where Might the Market Go Next?
Confidently tackle the market’s ups and downs with independent research and analysis that tells you where we think stocks are headed—and why.
Related Resources
-
Expert Commentary Why Ken Fisher Is Optimistic About European Stocks
 2026-07-23
 -
Economics A Summertime Check-in on US Consumers2026-07-23
-
Market Analysis Why the SOX “Bear Market” Isn’t Foreboding2026-07-21
-
Politics Blunting Burnham?2026-07-21


Learn More
Learn why 210,000 clients trust us to manage their money and how Fisher Investments and its affiliates may be able to help you achieve your financial goals.
As of 6/30/2026
New to Fisher? Call Us.
Contact Us Today