Personal Wealth Management / Market Analysis
2017 Post-Game Wrap
In which we present some awe-inspiring charts of 2017 returns.

In today’s electric MarketMinder commentary, we bring you the second installment in our look back at 2017. It was a good year. That, you probably knew. But did you know how each sector and region did? No? Well then! Here are two charts to show you.
Exhibit 1: Sector Returns in 2017
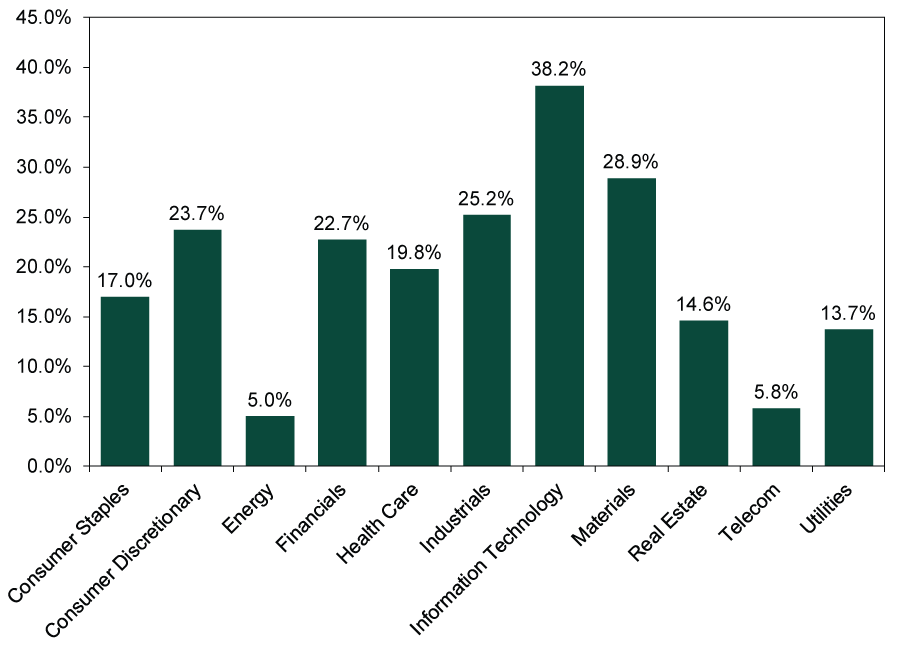
Source: FactSet, as of 1/9/2018. MSCI World Index sector returns with net dividends.
Exhibit 2: Major Regions’ Returns in 2017
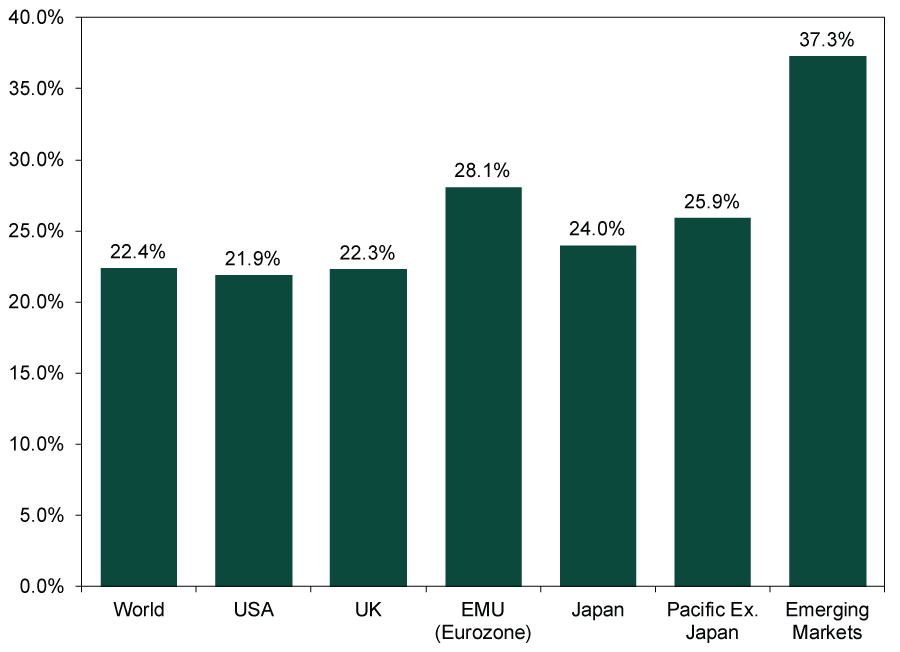
Source: FactSet, as of 1/9/2018. MSCI Index returns. US returns include gross dividends; all others include net dividends.
These big-picture returns obscure some interesting nuggets. Take Financials. Looking at the sector-level return only, you might get the sense Financials had an average year—after all, they basically matched the world’s return. But look under the hood, and you will see Financials returns varied considerably by region. US and Asian Financials might have been in line with the MSCI World Index, but UK and eurozone Financials outperformed. By a lot. That makes sense when you remember US banks entered the year with much higher expectations, tied largely to hopes for deregulation under the new presidential administration. Instead, Dodd-Frank remained unchanged, while the yield curve flattened and loan growth slowed. Eurozone Financials, by contrast, entered 2017 widely feared. Falling political uncertainty (that alleviated fears of a rekindled euro crisis), steeper yield curves and accelerating loan growth proved positive surprises.
Exhibit 3: A Regional Look at Financials
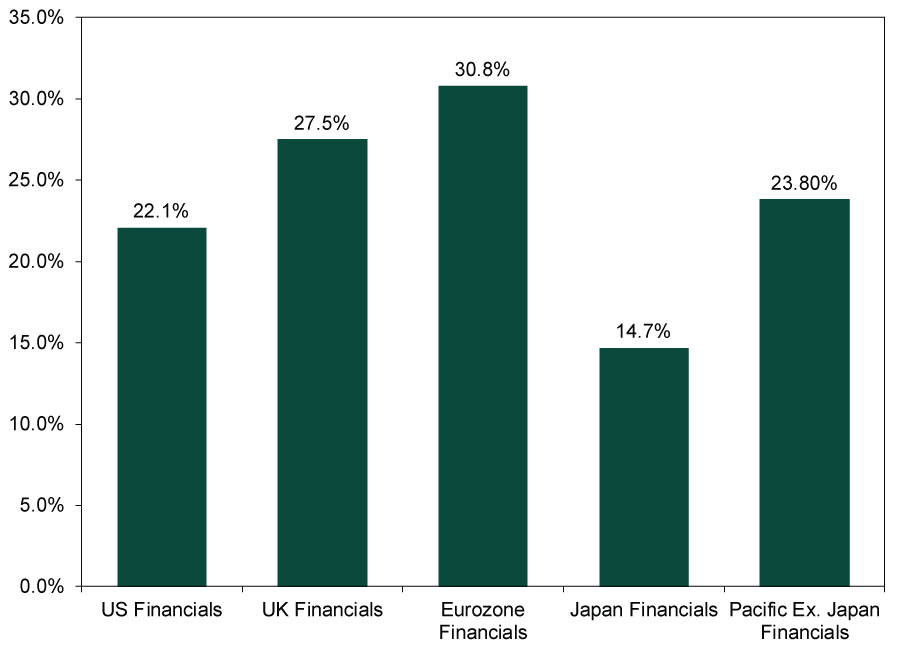
Source: FactSet, as of 1/9/2018. MSCI USA Financials return with gross dividends; MSCI UK Financials, MSCI EMU Financials, MSCI Japan Financials and MSCI Pacific Ex. Japan Financials returns with net dividends.
Full-year returns also gloss over shorter-term volatility. For instance, Energy was the year’s worst sector. But it would have been even worse if not for an autumn rally, which raises a key question: Are Energy stocks a buy? If you look solely at Exhibit 4, you might think so.
Exhibit 4: Energy Stocks in 2017
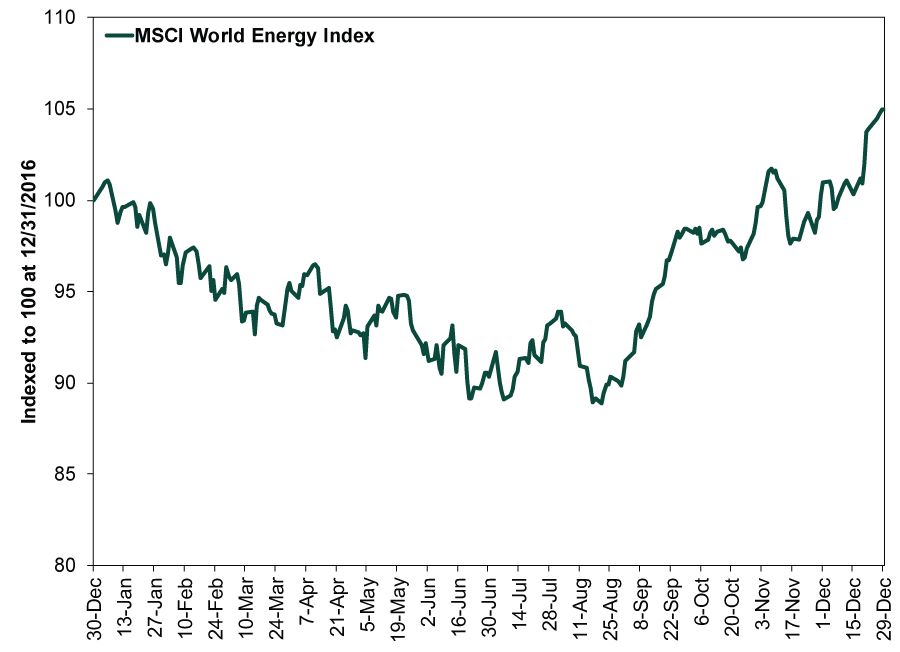
Source: FactSet, as of 1/9/2018. MSCI World Energy Index return with net dividends, 12/31/2016 – 12/31/2017. Indexed to 100 at 12/31/2016.
But hold your horses. Even with that big bounce, Energy didn’t outperform bigly. Exhibit 5 shows relative returns, with Energy outperforming when the line is rising.
Exhibit 5: Energy’s Relative Performance in 2017

Source: FactSet, as of 1/9/2018. MSCI World Energy and MSCI World Index returns with net dividends, 12/31/2016 – 12/31/2017. Indexed to 1 at 12/31/2016.
Lackluster relative returns or no, the key question is: Was that strong finish a countertrend or the start of something long? We are inclined to say countertrend. The reversal didn’t coincide with some strong improvement in Energy sector fundamentals. If anything, they got worse. While demand increased alongside global growth, the supply glut got worse. OPEC continued struggling to comply with its self-imposed production cuts, and US output rose as the year progressed. By yearend, US oil production was flirting with 10 million barrels per day and closing in on record highs set decades ago. We suspect investors’ expectations for higher oil prices will prove too lofty, and this disappointment (as well as the reality of lower prices and weaker earnings) probably weighs on the sector’s returns for the foreseeable future.
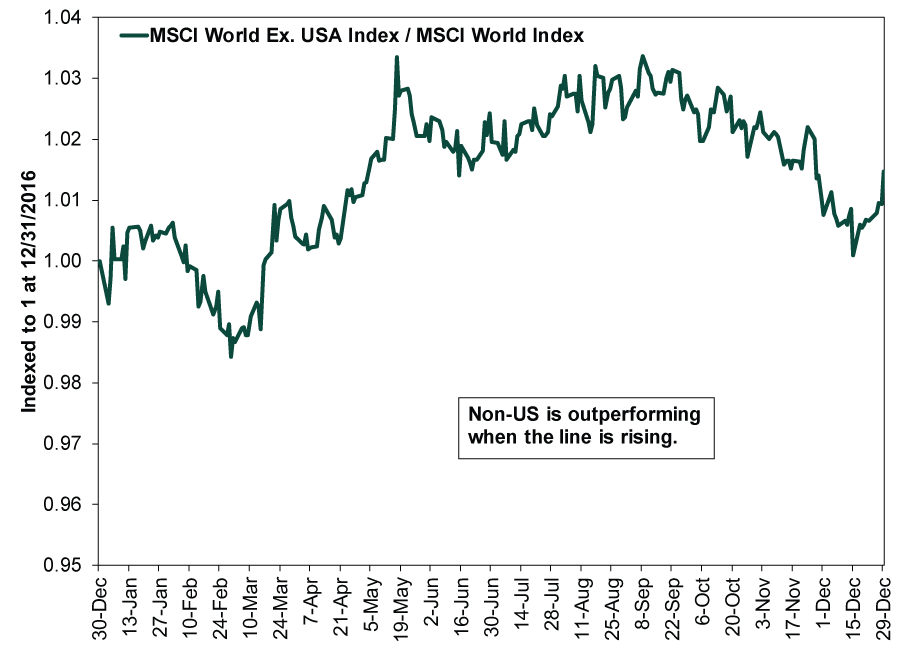
There is one other late-2017 countertrend we expect to reverse. While US stocks trailed over the full year, they did outperform in Q4 (until mid-December, at least). It is normal for country leadership to waffle in the short term. Even sustained leadership shifts have some give and take. Most importantly, the gap between sentiment and reality looks wider outside America—particularly in the eurozone. Last year’s solid economic growth, tax reform and earnings bounce helped further stir Americans’ animal spirits and raised economic expectations for 2018. In the eurozone, however, expectations are lower. There is still some political uncertainty in Germany, Spain and Italy, people still see the expansion as dependent on the ECB, and sentiment largely perceives banks as one sneeze away from crisis. Most ignore banks’ solid balance sheets, and few noticed that economic data and loan growth improved after the ECB first tapered its quantitative easing program last January. We expect similarly strong results following this latest round of tapering, delivering investors many happy surprises.
Exhibit 6: Non-US Stocks’ Relative Performance in 2017
If you would like to contact the editors responsible for this article, please message MarketMinder directly.
*The content contained in this article represents only the opinions and viewpoints of the Fisher Investments editorial staff.
Get a weekly roundup of our market insights
Sign up for our weekly e-mail newsletter.

You Imagine Your Future. We Help You Get There.
Are you ready to start your journey to a better financial future?

Where Might the Market Go Next?
Confidently tackle the market’s ups and downs with independent research and analysis that tells you where we think stocks are headed—and why.
Related Resources
-
Expert Commentary Ken Fisher on Measuring Inflation, Currency Reset, Commodities, and more2026-03-25
-
Interesting Market History COVID-Panic’s Lockdown-Low Anniversary2026-03-25
-
Market Analysis The Golden Paradox2026-03-24
-
In The News How investors should think about oil and stocks in the Iran war – in 3 simple steps2026-03-23


Learn More
Learn why 195,000 clients trust us to manage their money and how Fisher Investments and its affiliates may be able to help you achieve your financial goals.
As of 12/31/2025
New to Fisher? Call Us.
Contact Us Today