Personal Wealth Management / Economics
A Historic Q2 GDP Estimate?
What should investors focus on from the Q2 US GDP estimate?

Well folks, the US Bureau of Economic Analysis (BEA) has finally released its eagerly anticipated Q2 GDP report, and according to President Trump, “We have accomplished an economic turnaround of HISTORIC proportions.”[i] Though it seems a stretch to say this is an “economic turnaround”—the expansion has been chugging along for nine years now—we understand the enthusiasm. This is the fastest growth since 2014! Financial media have been speculating over Q2 growth all month, and the headlines are busy trying to figure out what it all means. Let us cut through the clamor—and review some history—to see this in context.
The BEA’s “advance” estimate shows Q2 GDP grew 4.1% annualized—the fastest since Q3 2014’s 4.9% and the fifth-fastest rate since this expansion began in Q2 2009. Q1 GDP growth was also revised up, from 2.0% to 2.2%. Looking under the hood, many of the underlying components were solid. Personal consumption expenditures jumped from Q1’s 0.5% to 4.0% while nonresidential fixed investment (business investment) rose 7.3%—slowing from Q1’s 11.5%. Government spending ticked up a bit, from 1.5% to 2.1%.[ii] On the trade front, exports sped up from Q1’s 3.6% to 9.3% while imports—which subtract from the GDP calculation, though they represent domestic demand—cooled to 0.5% from Q1’s 3.0%.
Change in private inventories was the outlier and detracted bigly, slicing a percentage point off headline growth. However, this is subject to interpretation. If businesses cut back in anticipation of lower demand—or perhaps pumped up exports by shipping out goods hurriedly—that may not be great. On the flipside, what if demand was stronger than expected and businesses need to restock? With investment and consumer spending way up, it seems weird to argue businesses are trying to get lean and mean right now. And, whether or not exports played a role, their small scope means restocking seems somewhat likely in coming quarters.
To remove the skew from volatile trade and inventory components—as well as government spending—we suggest looking at “Pure Private Sector GDP,” which sums consumer spending, business investment and residential fixed investment. From this perspective, Q2 GDP is solid—though not noticeably “historic” either.
Exhibit 1: Pure Private Sector GDP Since 2009
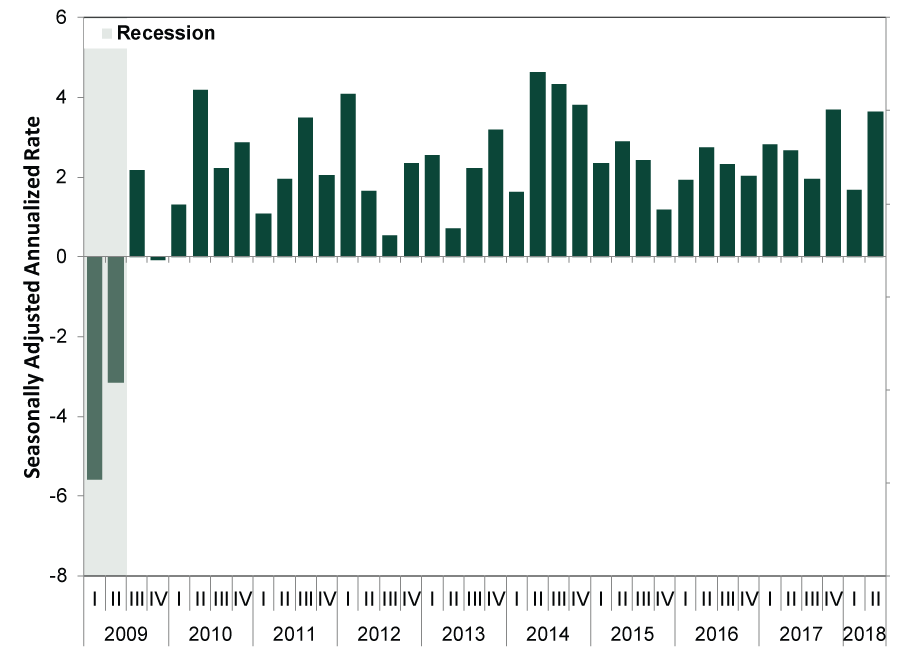
Source: BEA, as of 7/27/2018. US GDP growth, seasonally adjusted annualized rate, Q1 2009 – Q2 2018.
As for the financial media reaction, proponents cheered the first 4%+ annualized growth in almost four years, with many crediting the tax cut and friendlier business environment. Skeptics argued the uptick was likely a short-term sugar rush, as any tax reform benefits would soon fade. Moreover, some worried about the fallout from the US’s different trade tiffs. For example, that export acceleration may reflect the fact businesses front-loaded exports in anticipation of upcoming tariffs. The latest data show a surge in soybean exports as buyers sought to get ahead of China’s retaliatory levies.
In our view, these interpretations reflect current sentiment—and biases. As the Pure Private Sector components reveal, the domestic private sector is driving GDP. Consumers spending combined with businesses growing and investing make for a tasty growth cocktail. And just because businesses went into overdrive trying to get ahead of tariffs doesn’t mean said tariffs are actually a huge risk. Much of the rush may be psychological. Once that evens out, it wouldn’t shock to see trade growth revert to lower rates—not weak, necessarily, but more normal as it gradually becomes clear tariffs’ reach is small and easily avoidable.
Moreover, GDP in general can be pretty bouncy. The divergence between Q2 and Q1 in particular is notable—perhaps a reflection of the BEA’s well-known struggle with estimating the first quarter of the year (which the BEA now claims it has fixed).
Exhibit 2: US GDP Since 2009 (Q2s Highlighted)
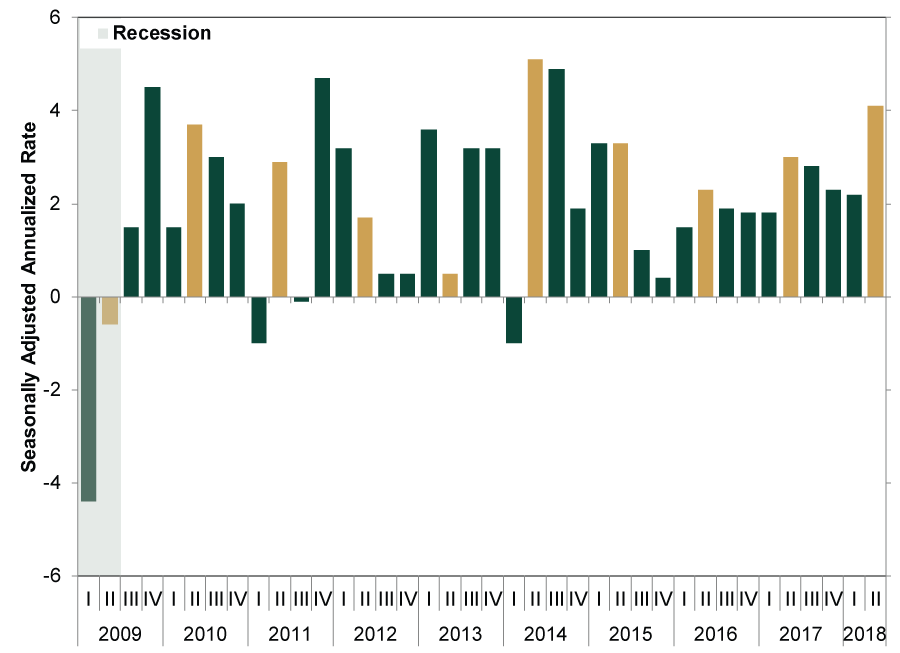
Source: BEA, as of 7/27/2018. US GDP seasonally adjusted annualized rate, Q1 2009 – Q2 2018.
The BEA’s advance estimate also gave us some insight into the dueling GDP forecasts between the Atlanta Fed’s “GDPNow” and the New York Fed’s “Nowcast,” both of which got a lot of attention in recent weeks. The Atlanta Fed’s estimate exceeded 4% at times while the New York Fed’s regularly fell below 3%. Based on GDPNow’s latest forecast of 3.8%—down from the mid-July estimate of 4.5%—it looks like the Atlanta Fed “won.”[iii] However, we caution investors against getting too caught up with these projections. Neither is perfect and, while they occasionally approximate the advance report, these data are often revised. In both cases, these estimates confirm what stocks have long known: The US economy has been on firm footing and growing nicely for a while.
Speaking of revisions, the BEA also announced a comprehensive update to how they calculate the numbers—a regular practice. The timespan covered was 1929 – Q1 2018. Not too much changed. For example, from 1929 – 2012, the average annual growth rate was 3.2% (unrevised from previous estimates). There were still 14 recessions, and the Great Depression wasn’t suddenly erased from history. The BEA also updated some descriptions in personal consumption expenditures “to better reflect the rapidly changing digital economy.” And one more interesting note: The BEA found Americans’ savings rate perhaps isn’t as poor as feared. Rather than 3.4% in 2017, it was 6.7%—almost double! Turns out they underestimated small business profits, which count as income.
In our view, these are all reminders to refrain from ascribing too much meaning to all things GDP. It is the best gauge we have today in trying to figure what a national economy broadly did, but it is far from perfect. Besides being subject to constant revision, it is also backward-looking. For investors, remember stocks look forward—and with leading economic indicators pointing to more growth, the solid economic backdrop underpinning this bull market remains intact.
[i] Source: https://twitter.com/realDonaldTrump/status/1022879441767288834
[ii] This isn’t an automatic positive in the real world, but in GDP’s math, more government spending is auto-positive.
[iii] Even by Price Is Right rules!
If you would like to contact the editors responsible for this article, please message MarketMinder directly.
*The content contained in this article represents only the opinions and viewpoints of the Fisher Investments editorial staff.
Get a weekly roundup of our market insights
Sign up for our weekly e-mail newsletter.

You Imagine Your Future. We Help You Get There.
Are you ready to start your journey to a better financial future?

Where Might the Market Go Next?
Confidently tackle the market’s ups and downs with independent research and analysis that tells you where we think stocks are headed—and why.
Related Resources
-
Market Analysis Why “War Winner” Trades Are Off Base2026-03-20
-
Expert Commentary This Week in Review | Energy Markets, Fed Meeting, Earnings Reporting
 2026-03-20
 -
Market Analysis Around the World in Central Banking, Iran War Edition2026-03-19
-
Politics Beyond the War: A Political Roundup Covering America, Canada and Denmark2026-03-17


Learn More
Learn why 195,000 clients trust us to manage their money and how Fisher Investments and its affiliates may be able to help you achieve your financial goals.
As of 12/31/2025
New to Fisher? Call Us.
Contact Us Today