Personal Wealth Management / Market Analysis
About the Eurozone’s ‘Record’ Inflation Surge
As in the US, one-off factors deserve the blame.

Record-high inflation. Biggest-ever jump. Those are two common phrases commentators used to describe the eurozone’s November inflation rate, never mind the fact that the eurozone itself is scarcely old enough to drink. Records come easy in young datasets, and this latest one doesn’t mean a 1970s repeat is at hand. Rather, a quick look at the limited data available in the “flash” release for the eurozone and member-states shows that—as in the US—prices are up on the collision of three temporary factors: supply shortages, base effects and energy prices. That people think otherwise suggests there is a lot of room for stocks to climb the inflation wall of worry.
It is of course true that eurozone inflation, which hit 4.9% y/y, is relatively high and up sharply from October’s 4.1%.[i] But a lot of that comes from energy prices, up an astronomical 27.4% y/y and 2.9% m/m.[ii] Excluding energy, food, alcohol and tobacco (i.e., the eurozone’s version of “core” inflation), prices rose 2.6% y/y and just 0.1% m/m.[iii] Non-energy industrial goods rose 0.4% m/m, bringing their year-over-year increase to 2.4% as supply shortages continued, but services prices continued easing with a -0.2% m/m drop—a sign that reopening from lockdowns has largely run its course as an inflation driver.[iv]
But the base effect hasn’t petered out yet. As Exhibit 1 shows, the eurozone was still in deflation a year ago, lowering the denominator in late-2021’s year-over-year calculations. The impact is even clearer when you look at the two biggest member-states: Germany and France. German inflation jumped to 6.0% y/y in November, the fastest since reunification.[v] But French inflation barely inched higher, from 3.2% y/y in October to 3.4%.[vi] Not because France has stolen Germany’s traditional price stability, but because Germany experienced sharp deflation in 2020’s second half after the government temporarily slashed its value-added tax (VAT) in the name of COVID relief. France, which didn’t cut VAT, didn’t have deflation last year. That means its year-over-year calculation base is higher than Germany’s, subjecting today’s inflation rate to less artificial upward skew.
Exhibit 1: Eurozone’s Inflation “Liftoff” Builds on Low Base
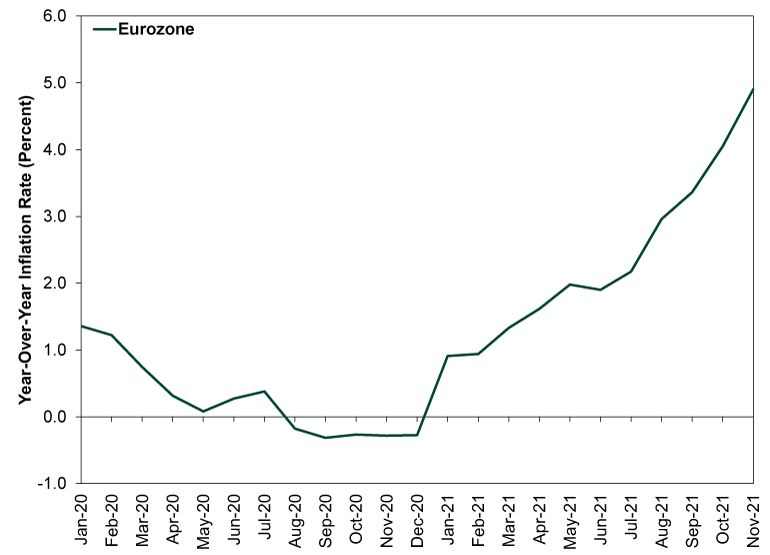
Source: FactSet, as of 11/30/2021. Eurozone Harmonized Index of Consumer Prices (HICP), January 2020 – November 2021.
Exhibit 2: France and Germany Illustrate the Base Effect
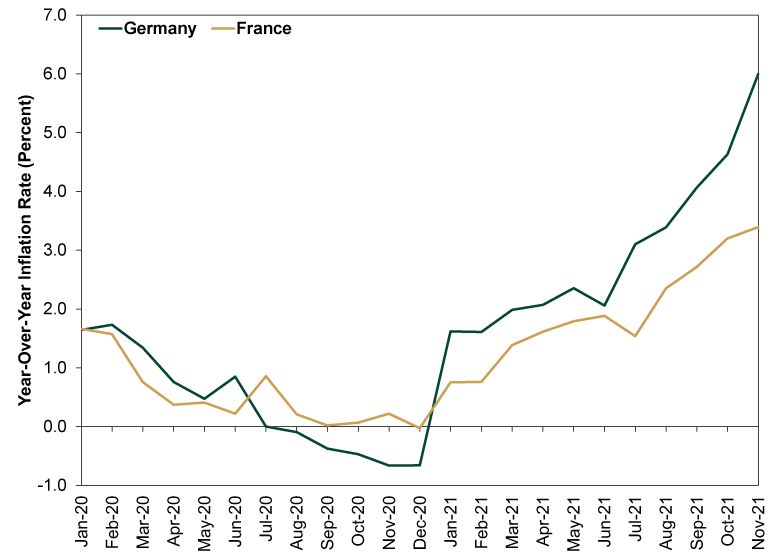
Source: FactSet, as of 11/30/2021. Germany and France HICP, January 2020 – November 2021.
Not that the base effect alone is sufficient reason to dismiss higher prices—it isn’t. Households have had to swallow higher costs, especially on the energy front. Yet big short-term price increases aren’t synonymous with lasting inflation. For inflation to stay high for any meaningful timeframe, energy and other prices would have to keep rising at a fast clip from here. Right now, we don’t see reason to believe that is likely. As we have covered numerous times in this space, there are oodles of indications that the supply chain crunch is starting to ease. Same goes for energy prices, as oil production ramps up globally and European utilities adjust in the wake of the natural gas shortage. That doesn’t mean prices will plunge from here, but slowing inflation doesn’t require that.
As Exhibit 3’s hypothetical illustration shows, if prices stay at November’s level for the next year, the inflation rate will slow as the base rises. That is an unlikely scenario, of course, but it illustrates the concept of a one-time price increase working its way in and out of the inflation rate.
Exhibit 3: Transitory Inflation, Version 1
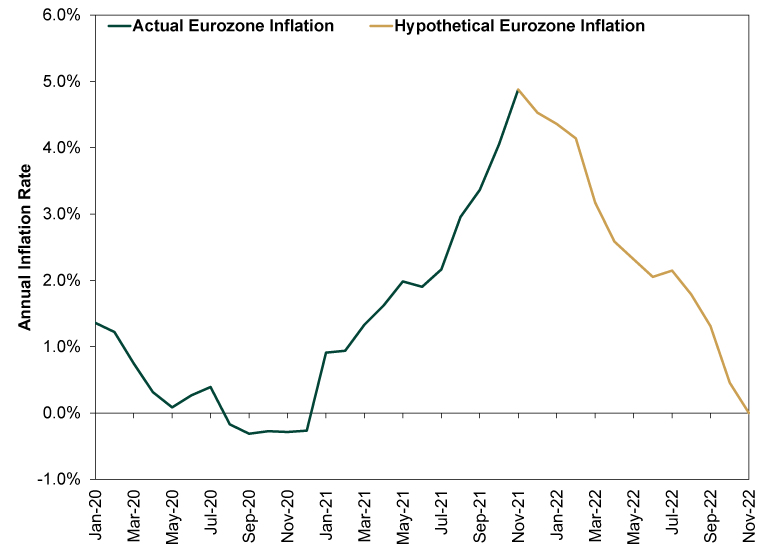
Source: FactSet and Math, as of 11/30/2021. Eurozone HICP, January 2020 – November 2021; presumes a 0.0% m/m inflation rate from December 2021 – November 2022.
Even in a more realistic hypothetical scenario of prices rising at 0.3% m/m, which is the US’s long-term average, the year-over-year inflation rate would ease.[vii] (Exhibit 4) Milder price increases off a higher base is the definition of “transitory” inflation (even if folks don’t want to use that term any more for some reason).
Exhibit 4: Transitory Inflation, Version 2
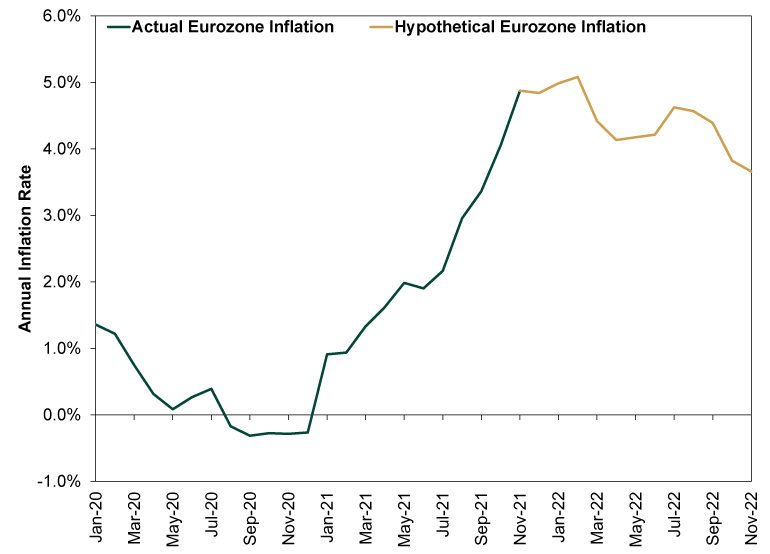
Source: FactSet and Math, as of 11/30/2021. Eurozone HICP, January 2020 – November 2021; presumes a 0.3% m/m inflation rate from December 2021 – November 2022.
As for the inevitable chatter about ECB policy, which accompanied the inflation data, we think it remains off base. One, supply shortages and energy prices are outside central banks’ control. Two, even if inflation were coming from “too much money” rather than “chasing too few goods,” ending quantitative easing asset purchases wouldn’t fix it. When the ECB and other central banks buy long-term assets, they tamp down long-term interest rates, which flattens the yield curve. Banks borrow at short-term rates and lend at long-term rates, making the yield curve a reference for their potential profit margins on new loans. When it flattens, potential profits flatten, which saps lending. When the yield curve steepens and potential profits widen, banks tend to lend more, which speeds money supply growth. If the ECB were to stop quantitative easing tomorrow, the yield curve would probably steepen a bit. That is inflationary, not deflationary.
In short, give it time. Today’s price pressures won’t last forever. When they ease, we think there is a world of positive surprise in store for the masses who are freaked about inflation today. Inflation isn’t inherently a stock market risk, in our view, but inflation fears seem to be holding down expectations now. Stocks move on the gap between reality and expectations, and as inflation fears gradually fade, it should help stocks climb up the wall of worry.
If you would like to contact the editors responsible for this article, please message MarketMinder directly.
*The content contained in this article represents only the opinions and viewpoints of the Fisher Investments editorial staff.
Get a weekly roundup of our market insights
Sign up for our weekly e-mail newsletter.

You Imagine Your Future. We Help You Get There.
Are you ready to start your journey to a better financial future?

Where Might the Market Go Next?
Confidently tackle the market’s ups and downs with independent research and analysis that tells you where we think stocks are headed—and why.
Related Resources
-
Market Volatility Some Timeless Counsel After March’s Volatility2026-04-01
-
Market Analysis Countertrends and Corrections: Banks in 2026’s Early Selloff2026-04-01
-
Market Analysis What the Latest Global Flash PMIs Reveal2026-03-31
-
Weekly Wrap-Up Fisher Investments Reviews: Last Week in Markets—March 23 - March 272026-03-30


Learn More
Learn why 200,000 clients trust us to manage their money and how Fisher Investments and its affiliates may be able to help you achieve your financial goals.
As of 3/31/2026
New to Fisher? Call Us.
Contact Us Today