Personal Wealth Management / Economics
Addressing the Latest on Rising US Debt
Rising interest rates mean more expensive debt—should investors be worried?

Editors’ Note: MarketMinder’s commentary is intentionally nonpartisan. We favor no party nor any politician and assess developments solely for their potential market and economic effects.
Last week, the US Treasury announced gross national debt exceeded $31 trillion for the first time and, predictably, the huge number spurred myriad concerns. Chief among them: Rising interest rates mean higher borrowing costs—so does that mean America’s finances are in trouble? We don’t think so.
As a lot of coverage noted, the $31 trillion figure refers to gross debt—i.e., total debt outstanding, which includes debt owned by the Federal Reserve, private investors and intragovernmental agencies. We think it is more accurate to focus on net public debt (i.e., debt held by investors and the Fed), which is $24.3 trillion—and not because the figure is smaller.[i] Rather, net public debt excludes the money the government owes itself, which effectively cancels. (You can read more about that here.)
Now, it is true debt has risen quickly in recent years—whether on a gross or net basis (Exhibit 1)
Exhibit 1: The Recent Jump in US Debt
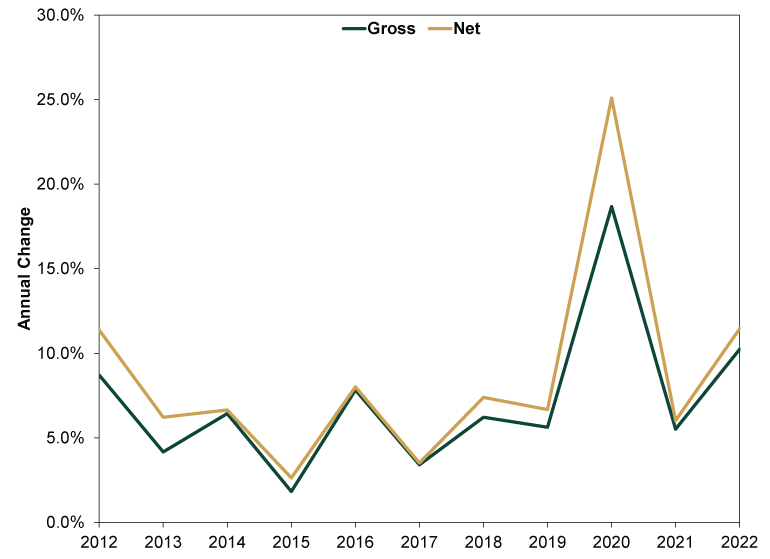
Source: Office of Management and Budget, as of 10/11/2022. Federal debt at fiscal year-end, 2012 – 2022. Note: 2022 is an estimate.
Much of the coverage gets political on this point, which we caution investors against. The debt increase occurred partly under President Joe Biden and partly under former President Donald Trump—it is bipartisan. Moreover, much of it is tied to pandemic-related spending—likely a one-off, not a repeating occurrence. According to the Treasury, federal spending is down -15% (-$943 billion) from fiscal 2021 to fiscal 2022.[ii] The federal deficit also fell -11.4% in fiscal 2021 from 2020, and the CBO predicts a far larger drop—on the order of -$1.4 trillion or -50%—in fiscal 2022.[iii] Those figures are preliminary, given the government’s fiscal 2022 just ended on September 30, but we doubt they change much.
Politicians can and likely will spin this however they want. Some outlets are already focusing on the fact that 2022’s final deficit is significantly larger than the May estimate, owing largely to accounting rules surrounding the current administration’s decision to write off some student debt. But the fact is, while 2021’s drop was about rising revenue tied to economic growth, this year’s steep fall combines revenue gains and reduced spending. How? The spending plans passed this year are mostly long term, while the short-term, COVID-related stuff is rolling off. In other words, the deficit is down from a high, one-off base created by the COVID lockdowns’ revenue effects and the impact of spending.
Many worry America’s debt load will climb as the government cranks up borrowing over next several years to pay for recent spending bills—and they fret rising interest rates make for increasingly expensive borrowing. That is possible, but these plans dole spending out slowly over a long period. No 10-year spending plan is ever set in stone. Government spending could be less than currently planned depending on political winds. For example, projected spending tied to the infrastructure bill must get Congressional approval every year due to the budget resolution rules. Depending on which party controls the House and Senate in the coming years, spending may be canceled or deployed elsewhere—it is far from certain debt will climb as estimated now, especially if growth boosts tax revenues more than currently anticipated.
As for interest rates, they are rising and at a 14-year high. But they remain low relative to much of the past 50 years—and a long ways away from the early 1980s. (Exhibit 2)
Exhibit 2: US 10-Year Treasury Yield, 1970 - 2022
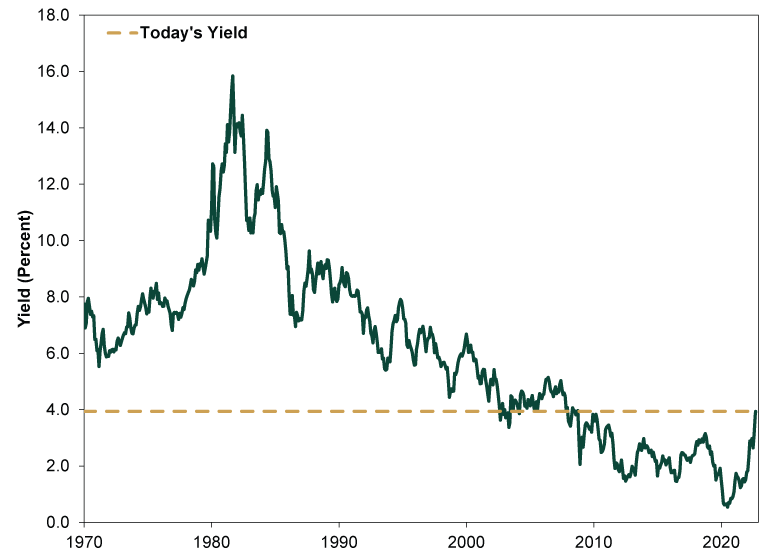
Source: FactSet, as of 10/11/2022. US 10-Year Treasury Yield, monthly, January 1970 – September 2022.
Beyond interest rate levels, the most critical question: Can the US meet its debt interest payments? To figure this out, we compare US interest payments to tax revenues. According to the Congressional Budget Office’s (CBO) preliminary estimates for fiscal year 2022, net interest payments comprised 10.9% of tax revenues.[iv] For context, this is well below the 15.6% average from 1980 – 2000—a pretty prosperous period for the American economy.[v] If that higher share didn’t hinder the US then, we think it is a stretch to say a lower ratio is problematic now.
While America’s finances may not be in dire straits today, some think the future looks bleaker due to more expensive debt service in the coming years. In one prominent example, a column in The Washington Post ran an estimate of future interest costs, assuming the 10-year Treasury yield was 1.5 percentage points higher than the CBO’s latest interest-rate projections over the next decade.[vi] Being curious, analytical folks, we enjoyed the exercise, although we always quibble with straight-line math like this no matter who employs it. And as usual when straight-line projections are employed, the figures get big quickly—for example, based on this hypothetical, interest payments for fiscal year 2024 would be $194 billion higher than CBO’s approximations.[vii] The estimated gap widens even further over time, to the tune of over $500 billion by 2032. In a vacuum, that is large, though if revenues also grow over time, it helps defang the situation.
For argument’s sake, let us build out the analysis with the CBO’s revenue projections. Using their figures, interest payments as a percentage of tax revenues would rise over the next 10 years—but not to historically unprecedented levels. (Exhibit 3) If interest payments are more in the neighborhood of the Post’s estimates and revenue mirrors the CBO’s projections, interest payments as a percentage of tax revenues would reach a new all-time high in fiscal 2027 and be around 25% by fiscal 2031. This would be new for America, though not a historical anomaly among developed nations—the UK could afford paying over 30% of tax revenues on interest throughout the mid-to-late 20th century without suffering a debt crisis. There is no specific threshold in which debt becomes suddenly onerous and troublesome, which is worth keeping in mind for investors. Note, too, that when America hit its all-time high in 1991, we were on the precipice of one of the best decades in US economic and stock market history.
Exhibit 3: A Hypothetical Long-Term Projection
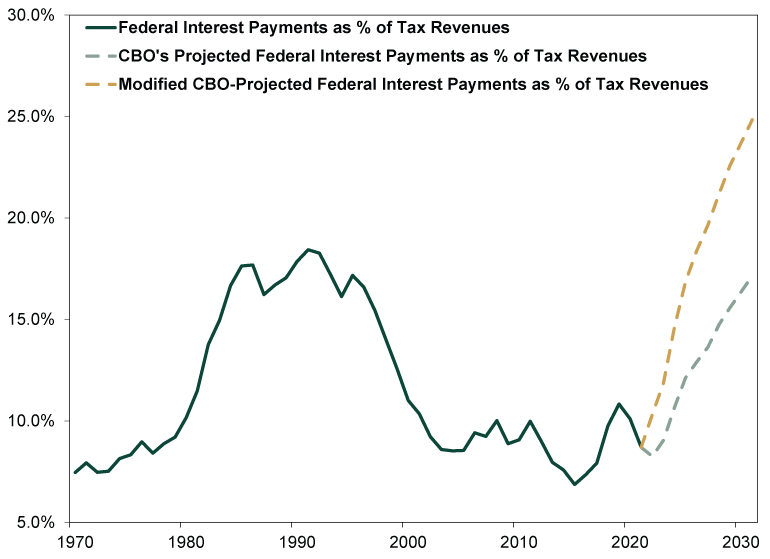
Source: St. Louis Federal Reserve, Congressional Budget Office and The Washington Post, as of 10/13/2022. Federal interest outlays as a percentage of annual federal receipts, 1970 – 2021. Note: Dotted lines from 2022 – 2031 are based on CBO projections and calculations from The Washington Post column “With Rising Rates and Rising Debt, the Taxpayer Bill Is Finally Coming Due.”
Yet we would be remiss if we didn’t point out one major caveat to all of these numbers: They all use straight-line math to estimate the next decade. But life doesn’t move in a straight line. Economies and markets—and therefore tax revenue and interest—are cyclical. Already, Republican congresspeople are discussing inserting budgetary control measures into the next debt ceiling bill if they take the House, which could put spending (and future deficits) below the CBO’s estimates. Bond market volatility could ease, lowering interest rates. Faster-than-expected economic growth could lift revenues. Whatever the future of America’s debt service costs, it will probably look bouncier than the straight-line extrapolations in Exhibit 3.
It is possible far-flung reality turns out worse than anticipated today—but only in the sense that anything is possible. We also aren’t saying US can add debt limitlessly. But the issue isn’t problematic over the next 3 – 30 months—the timeframe stocks care about and what we think investors should focus on in terms of portfolio decisions.
[i] Source: US Treasury, as of 10/12/2022. Figure from “Daily Treasury Statement” for Monday, October 3, 2022.
[ii] Ibid. Statement is from Monthly Treasury Statement and based on gross outlays for fiscal 2022 (October 2021 – August 2022) and fiscal 2021 (October 2020 – August 2021). Fiscal year ends on September 30.
[iii] Source: St. Louis Federal Reserve, as of 10/12/2022. “Federal Deficit Fell by $1.4 Trillion in Fiscal Year 2022, CBO Estimates,” Amara Omeokwe, The Wall Street Journal, 10/12/2022.
[iv] “Monthly Budget Review: September 2022,” Congressional Budget Office, 10/11/2022.
[v] Ibid.
[vi] “With Rising Rates and Rising Debt, the Taxpayer Bill Is Finally Coming Due,” Allan Sloan, The Washington Post, 10/13/2022.
[vii] Ibid.
If you would like to contact the editors responsible for this article, please message MarketMinder directly.
*The content contained in this article represents only the opinions and viewpoints of the Fisher Investments editorial staff.
Get a weekly roundup of our market insights
Sign up for our weekly e-mail newsletter.

You Imagine Your Future. We Help You Get There.
Are you ready to start your journey to a better financial future?

Where Might the Market Go Next?
Confidently tackle the market’s ups and downs with independent research and analysis that tells you where we think stocks are headed—and why.
Related Resources
-
Market Analysis Around the World in Central Banking, Iran War Edition2026-03-19
-
Politics Beyond the War: A Political Roundup Covering America, Canada and Denmark2026-03-17
-
Economics Doubts Aplenty After UK January GDP Flatlined2026-03-17
-
Economics US Data Stronger Under the Hood Than Many Realize2026-03-16


Learn More
Learn why 195,000 clients trust us to manage their money and how Fisher Investments and its affiliates may be able to help you achieve your financial goals.
As of 12/31/2025
New to Fisher? Call Us.
Contact Us Today