Personal Wealth Management / Economics
An Economic Data Check-In
A look at recent data from the US and Germany suggests conditions aren’t as weak as feared.

Lately, economic data have been coming out a bit better than expected. While a backward-looking glance won’t dictate where markets are headed, it does help lay down the baseline reality from which to gauge sentiment. Have a look.
July’s personal consumption expenditures (PCE) release last Friday showed inflation-adjusted consumption rising at Q3’s start and inflation moderating. Real PCE—aka consumer spending—rose 0.2% m/m. (Exhibit 1) That isn’t gangbusters, but it is right on its monthly average rate since 2002. Underlying demand is holding up despite inflation.
Exhibit 1: Consumer Spending Growth Slow, but Still Upward
Source: Federal Reserve Bank of St. Louis, as of 8/31/2022. Real PCE and its goods and services components, January 2002 – July 2022.
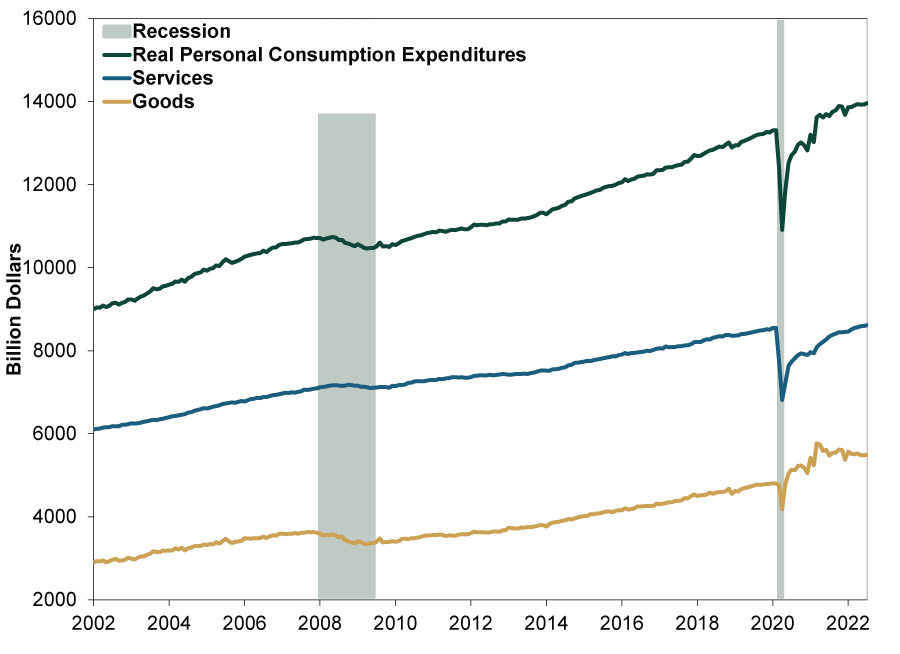
Under the hood, real PCE’s services and goods components show some normalization. With services consumption (blue) back at pre-pandemic levels this spring, growth has also leveled off—it rose 0.2% m/m in July and has averaged that since March. After surging during lockdowns, goods spending (yellow) has flattened since spring 2021 as restrictions relaxed. However, the divergence paused as July spending on goods grew 0.2% m/m, too. While spending on non-durable goods declined, spending on durable goods jumped for the second month running, rising 1.5% m/m. It could be that as gasoline prices fell, people had more bandwidth to buy bigger-ticket items.
The PCE report also indicated price pressures may be starting to ease some. People seem well aware gas prices aren’t quite as crushing anymore, perhaps affording a bit more room on folks’ grocery bills, if not for utilities. The numbers reflect these perceptions. July’s PCE price index ticked -0.1% m/m lower, decelerating to 6.3% y/y from June’s 6.8% 40-year high. (Exhibit 2) This was largely due to declining gas prices, as PCE’s energy price index fell -4.8% m/m. Food prices continued to rise, though, up 1.3% m/m. Excluding food and energy, the core PCE price index ticked up 0.1% m/m and decelerated more modestly to 4.6% y/y from 4.8%. That said, the latest reading is notably below February’s 5.3% y/y rate.
Exhibit 2: Inflation Starting to Moderate?
Source: Federal Reserve Bank of St. Louis, as of 8/31/2022. PCE price index and its “core” measure excluding food and energy, January 1960 – July 2022.

Another report out last week: durable goods orders, which were flat in July owing to a big drop in military aircraft, which can be quite lumpy month to month. One way to rectify this: Strip out volatile components—nondefense capital goods orders excluding aircraft rose 0.4% m/m. (Exhibit 3)
Exhibit 3: ‘Core’ Durable Goods Orders Making New Highs
Source: Federal Reserve Bank of St. Louis, as of 8/31/2022. Nondefense capital goods orders excluding aircraft, February 1992 – July 2022.

Note that these data aren’t inflation-adjusted, so the rise may just reflect higher prices—not more actual stuff. Furthermore, PPI would reflect prices for this investment, and PPI presently exceeds CPI. But also, durable goods aren’t a full look at business investment. As compiled in GDP, durable goods—vehicles, machinery and equipment—make up only 45% of firms’ capital expenditures.[i] They spend almost as much—42%—on software, research and development and other intangible intellectual property. (The rest is structures, e.g., buildings, factories, warehouses, drilling platforms, refineries and other storage facilities.) But durable goods orders do show higher interest rates aren’t deterring spending on new equipment. Deep and widespread business retrenchment isn’t evident here.
Looking abroad, Germany recently revised up its Q2 GDP growth to 0.1% q/q from flat in its initial estimate. (Exhibit 4) So after Q1’s recovery back to Q4 2019’s pre-pandemic level, the German economy has expanded further. Although Q2 is well in the rearview, the new release quantifies what was only general color commentary from Germany’s Federal Statistics Office before. Namely, real household consumption rose 1.0% q/q, accelerating from Q1’s 0.8%.[ii] This occurred after most COVID restrictions eased, so the bump is relatively unsurprising. Reopening boosts as pent-up demand unleashes have been a consistent pattern worldwide. Somewhat offsetting this: business investment, which fell -1.3% q/q. This all came from commercial construction’s -3.4% q/q decline. Firms’ machinery and equipment spending rose 1.1% q/q for its third quarterly rise.
Exhibit 4: Despite Challenges, German GDP Continued to Grow Through Q2
Source: FactSet, as of 8/31/2022. German GDP, Q1 2013 – Q2 2022.
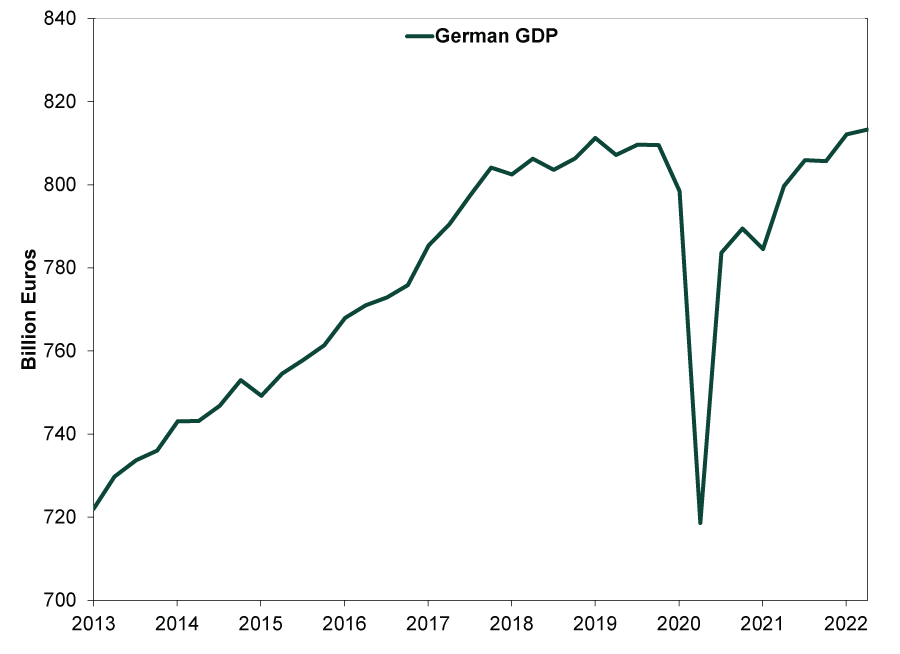
Also notable: trade’s contribution, as Q2 German exports rose 0.3% q/q despite exports to Russia taking a big hit. Surging energy imports to offset the loss of Russian gas flows detracted, as did German tourism outside the country. But overall, Germany managed ongoing GDP growth. Even amid high inflation and energy costs, economic conditions are turning up better than many fear.
Now, it is perhaps unsurprising, but in this day-and-age where the Pessimism of Disbelief has everyone couching any positive sign as soon to morph negatively, many see these better-than-expected data—in concert with jobs data—as indicating central banks will tighten policy much more from here, knocking stocks. That has seemingly stirred sentiment in the last few days, although we think the conclusions are questionable. For one, you never know how Fed officials are viewing the data, or even which data they think are important. Two, there is no preset relationship between Fed policy and stocks, so even if more rate hikes come, it wouldn’t be auto-bearish. That said, sentiment is viewing data through a dour lens, and that, historically, has been the foundation of bull markets.
If you would like to contact the editors responsible for this article, please message MarketMinder directly.
*The content contained in this article represents only the opinions and viewpoints of the Fisher Investments editorial staff.
Get a weekly roundup of our market insights
Sign up for our weekly e-mail newsletter.

You Imagine Your Future. We Help You Get There.
Are you ready to start your journey to a better financial future?

Where Might the Market Go Next?
Confidently tackle the market’s ups and downs with independent research and analysis that tells you where we think stocks are headed—and why.
Related Resources
-
Expert Commentary This Week in Review | Iran Conflict Volatility, March PMIs, Gold’s Recent Sell-Off
 2026-03-27
 -
Market Analysis Will Lower Capital Requirements Send Banks Higher?2026-03-26
-
Politics This Week in Gridlock: Europe Edition2026-03-26
-
Expert Commentary Ken Fisher on Measuring Inflation, Currency Reset, Commodities, and more2026-03-25


Learn More
Learn why 195,000 clients trust us to manage their money and how Fisher Investments and its affiliates may be able to help you achieve your financial goals.
As of 12/31/2025
New to Fisher? Call Us.
Contact Us Today