Personal Wealth Management / Politics
An Inaugural Reminder
Presidents don’t dictate market returns—for good or ill.

Editors’ Note: MarketMinder favors no politician nor any political party. We analyze political developments and news solely to weigh the potential impact on markets.
Just before noon Eastern Standard Time Wednesday, Joe Biden took the oath of office on the Capitol steps and became America’s 46th president. The backdrop was certainly unusual, with security extra-high and thousands of flags standing in for the throngs of people that ordinarily attend inaugurations. But nevertheless, power transferred amid some, if diminished, pomp and circumstance. To us, it is also a time to remember: Though the American president may be the world’s single most powerful person, they rarely impact stocks as much as some believe. This is a point we think is worth recalling as President Biden begins his term.
Around any election, talk of this-or-that candidate being “good” or “bad” for stocks is common. This time, many pundits cast Biden as the anti-market candidate while Donald Trump was supposedly bullish—a near total reversal of how he was cast in 2016, when most analysts presumed a Trump victory would doom markets. The doom failed to materialize in both cases.
After overnight futures blipped on election night in 2016 when Trump’s victory became clear, stocks took off, rising 6.2% through the inauguration. That was the so-called “Trump Rally” or, more melodiously, the “Trump Bump.” This time? There was no “Biden Slidin’.”Adjusted for the now-shorter time between the election and inauguration, the 14.8% return between Election Day and the inauguration is history’s highest at a simple average 0.19% gain per day—topping Herbert Hoover’s 0.14% after 1928’s election. Exhibit 1 shows this, plotting the returns between Election Day and the inauguration of newly elected presidents since reliable daily data begin in 1928.
Exhibit 1: Interregnum Returns, 1928 – 2021
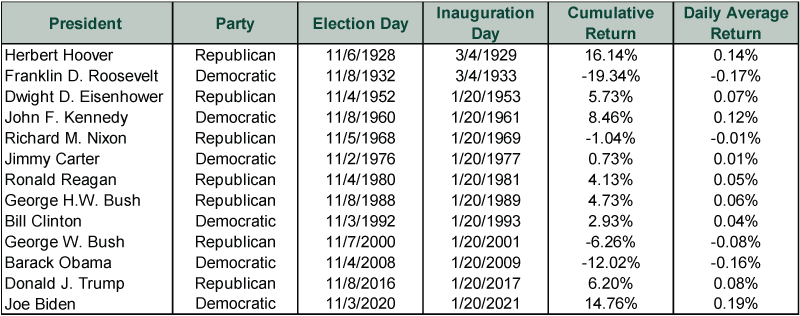
Source: FactSet, as of 1/20/2021. S&P 500 price returns, 1928 – 2021. Price returns used in lieu of total due to daily data availability. Daily average return used to account for the shorter window between the election and inauguration that began in 1937.
But before you dub this record-breaking market move a “Biden Bounce” or “Joe’s Jump,” consider: From early 2020’s bear market low on March 23 until Election Day, the S&P 500 rose 48.0% in price-only terms, a 0.21% average daily gain.[i] That is a rounding error higher than the post-election gain, suggesting the upturn thus far is more a continuation of the post-pandemic rebound than the start of something new. (Just like the “Trump Bump” was!) Now, returns had paused somewhat from September 2020 through the vote as election uncertainty built. The vote seemingly cleared this, allowing stocks to resume their climb.
This isn’t unique—prevailing trends usually continue post-election. Hoover won election as the Roaring ‘20s roared—and the roar continued for a while after. FDR’s win came near the Great Depression’s depths, extending the drop after the vote. (Many would argue his win came because of the Great Depression’s depths, but we digress.) George W. Bush and Barack Obama similarly won election amid broader bear markets largely unrelated to their election or policies, with downside extending after the vote, as Exhibit 1 shows. Perhaps the oddities around the contested Bush/Gore election exacerbated this in 2000. But it is hard to isolate that effect given the Tech bubble burst the previous March and downside continued through 2002.
Need more evidence the person in the White House doesn’t dictate returns? Consider: While much has been made in the financial press regarding returns during Trump’s presidency, the S&P 500 annualized 13.9% during this span.[ii] That is only a slight increase from its 13.1% annualized return while Obama was president.[iii] The fact two presidents who served back-to-back—featuring quite different policy platforms and styles—have such similar returns should show you there is much more at work in markets than the president can control.
Politics can and do influence markets, usually through legislation—which the president cannot control unilaterally. But beyond this, economic drivers play a huge role. Nearly nine-tenths—87.5%—of US GDP is generated by the private sector, outside the government’s direct reach.[iv] Further, demand for US stocks—and the goods US firms produce—is fully global. Nearly 40% of US firms’ revenues stems from outside the US, mitigating American politics’ influence.[v] Supply chains are similarly global.
So while politics can and do influence stocks—mostly through its influence on sentiment tied to biases—it is a mistake to overrate it.
[i] Source: FactSet, as of 1/20/2021. S&P 500 price return, 3/23/2020 – 11/2/2020.
[ii] Ibid. Annualized S&P 500 price return, 1/20/2017 – 1/19/2021.
[iii] Ibid. 1/20/2009 – 1/19/2017.
[iv] Source: US Bureau of Economic Analysis, as of 1/20/2021. Federal, state and local government value added as a percentage of US GDP, Q3 2020.
[v] Source: FactSet, as of 1/20/2021. Russell 3000 and S&P 500 revenue breakdown by geographic source.
If you would like to contact the editors responsible for this article, please message MarketMinder directly.
*The content contained in this article represents only the opinions and viewpoints of the Fisher Investments editorial staff.
Get a weekly roundup of our market insights
Sign up for our weekly e-mail newsletter.

You Imagine Your Future. We Help You Get There.
Are you ready to start your journey to a better financial future?

Where Might the Market Go Next?
Confidently tackle the market’s ups and downs with independent research and analysis that tells you where we think stocks are headed—and why.
Related Resources
-
Expert Commentary This Week in Review | Q1 Recap, Earnings Guidance, Elections
 2026-04-03
 -
Market Analysis A Forward-Looking Lesson One Year After Liberation Day2026-04-02
-
Market Volatility Some Timeless Counsel After March’s Volatility2026-04-01
-
Market Analysis Countertrends and Corrections: Banks in 2026’s Early Selloff2026-04-01


Learn More
Learn why 200,000 clients trust us to manage their money and how Fisher Investments and its affiliates may be able to help you achieve your financial goals.
As of 3/31/2026
New to Fisher? Call Us.
Contact Us Today