Personal Wealth Management / Economics
Checking In on Global Growth
Broad-based world growth shows plenty of demand powering the global bull.

Based on their name, you would think buzzwords would be, well, buzzy. Someone forgot to tell the powers that be in global economics, because according to Quartz, economists’ buzzword for 2018 is “synchronous.” As in, synchronous economic growth—a jargony and, in our view, weird euphemism for “lots of countries are growing.” It isn’t wholly accurate, as not every country on Earth is enjoying rising GDP, and it isn’t as unique for growth to be widespread as the buzziness suggests. Still, for investors, it is quite nice that GDP is growing in Emerging Markets as well as developed. Recently released data show large EM nations like India and Brazil contributing to global growth, but they aren’t the only ones. Plenty of other smaller emerging economies are joining in. This doesn’t make them great investments necessarily—stocks and GDP often diverge—but it does show global demand is strong, which benefits developed-world firms, too.
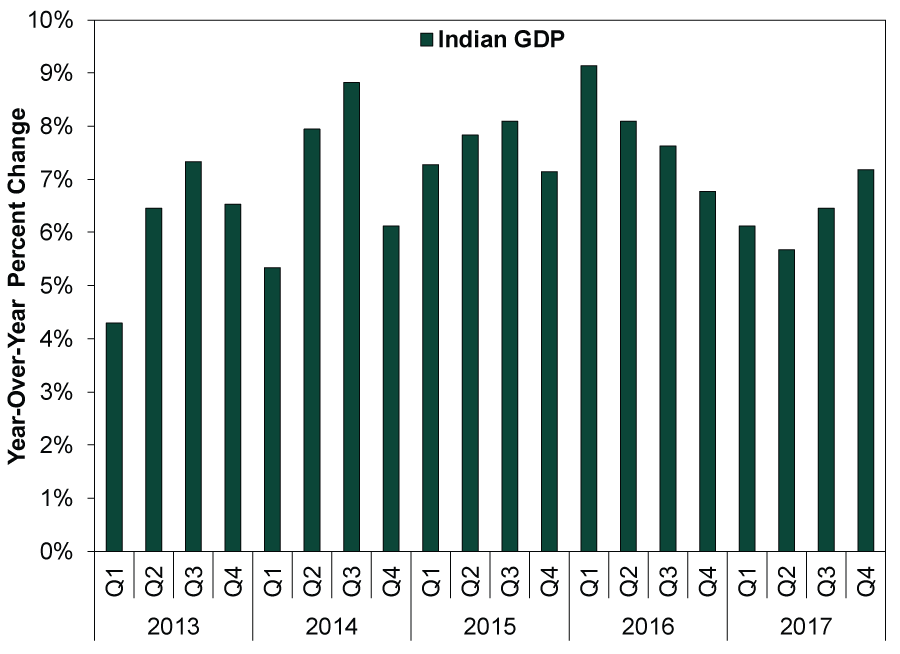
India’s Q4 GDP grew 7.2% y/y—the fastest among the world’s major economies—accelerating from Q3’s 6.5% and Q2’s 5.7% growth trough.[i] On the production front, manufacturing growth sped to 8.1% y/y from Q3’s 6.9%, while services—India’s largest sector—accelerated to 7.2% from Q3’s 5.6%.[ii] From an expenditure perspective, consumer spending growth slowed to 5.6% y/y from Q3’s 6.6%. While moderating over the last year, growth remains on a healthy trend near its five-year average.[iii] Indian businesses are also bustling. Gross fixed capital formation surged 12.0% y/y in Q4, accelerating from Q3’s 6.9% and continuing a rebound from Q1 2017’s dip.[iv] While this figure includes government investment as well as business investment, plenty of other private sector indicators suggest businesses have been expanding swiftly.
Policy uncertainty from late 2016’s demonetization and mid-2017’s tax overhaul temporarily stalled investment activity, but those headwinds appear to be past. While the goods and services tax (GST) rollout involved substantial changes to business operations for compliance, money supply has now recovered from the demonetization shock. After dipping to mid-single-digits in 2017, bank loan growth bounced back to 10.7% y/y in the two weeks ending February 16 and M3 money supply growth to 10.3%—both rates that prevailed before structural reforms and signaling India’s economy is back on track.[v]
Exhibit 1: India’s Growth Rebounds Following Structural Reform
Source: Ministry of Statistics and Programme Implementation, as of 3/8/2018. Year-over-year percent change in Indian GDP, Q1 2013 – Q4 2017.
While India surged, its BRIC bedfellow Brazil crawled but still managed to continue its recovery from the 2015 – 2016 recession. Brazil managed four quarters of growth in 2017 and rose 1.0% for the full year (Q4: 2.2% y/y).[vi] But its Q4 read was the slowest yet, at 0.1% q/q.[vii] Under the hood, consumer spending also rose just 0.1% q/q.[viii] More encouraging, gross fixed capital formation rose 2.0% q/q, accelerating from Q3’s 1.8% and further rebounding from Q1 2017’s dip.[ix] Trade, particularly in agricultural exports, was the main culprit for the weak Q4, which may reverse as harvests fluctuate. More significant for developed-world firms is that Brazilian domestic demand is crawling back. Conditions in Brazil aren’t exactly the world’s best, but the global expansion seems strong enough to lift even it.
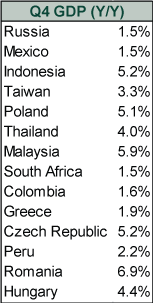
While large nations get the most headlines, smaller Emerging Markets are growing, too. Exhibit 2 shows EMs reporting Q4 GDP since February 1. Some have grown faster than others over the last year, but all have grown. Such a wide swath, with different drivers, suggests global growth underpinning the bull isn’t close to exhaustion. While EM investment situations differ, their common growth thread is a boon to the top-line revenues of developed-world multinationals catering to growing demand around the world—bullish for global stocks!
Exhibit 2: Emerging Markets’ Q4 GDP Growth at a Glance
Source: FactSet and Eurostat, as of 3/8/2018. Year-over-year percent change in GDP for listed countries, Q4 2017.
[i] Source: Ministry of Statistics and Programme Implementation, as of 3/8/2018.
[ii] Ibid.
[iii] Ibid.
[iv] Ibid.
[v] Source: Reserve Bank of India, as of 3/6/2018.
[vi] Source: Instituto Brasileiro de Geografia e Estatística, as of 3/8/2018.
[vii] Ibid.
[viii] Ibid.
[ix] Ibid. Year-over-year, Brazil’s Q4 investment growth was 3.7% compared with India’s 12.0% y/y, in case you were wondering.
If you would like to contact the editors responsible for this article, please message MarketMinder directly.
*The content contained in this article represents only the opinions and viewpoints of the Fisher Investments editorial staff.
Get a weekly roundup of our market insights
Sign up for our weekly e-mail newsletter.

You Imagine Your Future. We Help You Get There.
Are you ready to start your journey to a better financial future?

Where Might the Market Go Next?
Confidently tackle the market’s ups and downs with independent research and analysis that tells you where we think stocks are headed—and why.
Related Resources
-
Market Analysis Quick Hit: What to Make of Jobs Data’s Persistent Swings2026-04-07
-
Weekly Wrap-Up Fisher Investments Reviews: Last Week in Markets—March 30 - April 32026-04-06
-
Expert Commentary US Inflation, Fed Minutes, Consumer Sentiment | 3 Things You Need to Know This Week
 2026-04-06
 -
Expert Commentary This Week in Review | Q1 Recap, Earnings Guidance, Elections
 2026-04-03


Learn More
Learn why 200,000 clients trust us to manage their money and how Fisher Investments and its affiliates may be able to help you achieve your financial goals.
As of 3/31/2026
New to Fisher? Call Us.
Contact Us Today