Personal Wealth Management / Economics
China's Slowdown Isn't So Different This Time
The crackdown on shadow banking seems to be having a fairly predictable effect.

Chinese GDP growth slowed by a whisker to 6.7% y/y in Q2, just barely behind Q1’s 6.8%. Ordinarily a teensy Chinese slowdown wouldn’t be huge news, as it is par for the course of the last six years. But throw in a couple softer monthly data points and lingering handwringing over the latest tariffs (and tariff threats), and you get a proper “China’s economy is stumbling hard” freakout. However, a closer look shows this is less about trade and more about Chinese officials’ ongoing war on junky debt. It was largely a foregone conclusion that their efforts would inflict some collateral damage. The latest economic data are about what we would expect in that regard. And they are largely in line with the past several years—not a brewing negative shock in the world’s second largest economy or, in our view, the death knell for this global bull market.
Exhibit 1 shows the past 10 years’ worth of GDP growth. Since 2010, growth has slowed steadily—largely by design. Chinese officials decided several years ago that in order to maintain social stability and avoid getting caught in the proverbial middle-income trap, they would have to engineer a shift away from heavy industry and exports and toward services and consumption. Growth slowed as they curbed overcapacity in several key domestic industries, like steel, while the service sector slowly ascended to the country’s largest economic segment. GDP growth didn’t accelerate as services expanded, largely because the effects of compound growth make it difficult to keep notching double-digit growth rates off a larger base. But growth was somewhat higher-quality. The country continued prospering. And its dollar-based contributions to global GDP—which is what ultimately matters for global stocks—remained robust.
Exhibit 1: 10 Years of Chinese GDP Growth
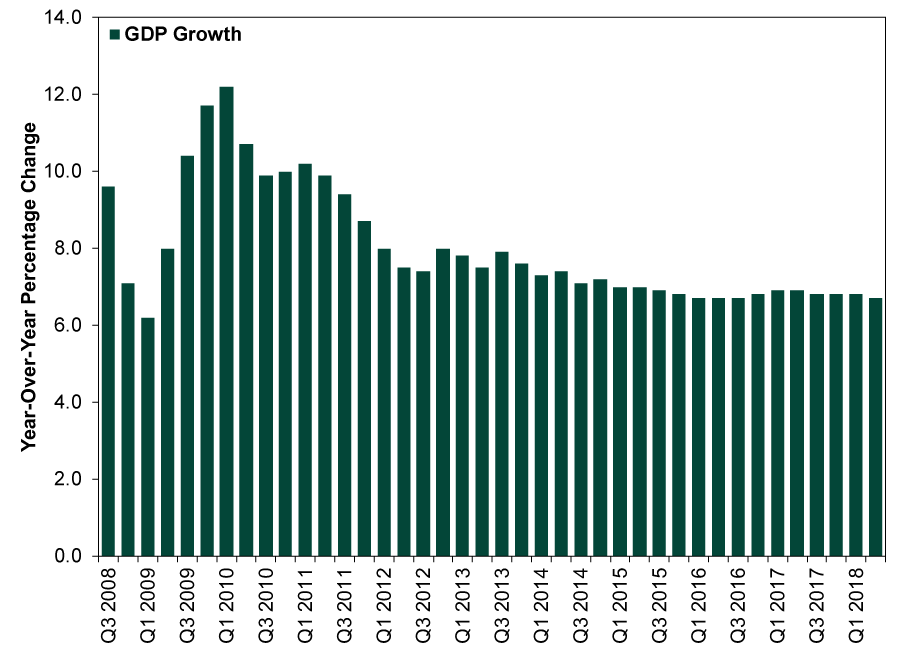
Source: FactSet, as of 7/16/2018. Year-over-year growth in Chinese real GDP, Q3 2008 – Q2 2018.
Exhibits 2 through 4 show three flagship monthly indicators during the last five years, as the slowdown leveled off—retail sales, industrial production and fixed asset investment. Because China combines all January and February year-over-year data into one month in order to avoid skew from the Lunar New Year’s shifting calendar placement, you will see empty spaces in every January. You will also see that recent blips aren’t out of step with past blips. Nothing here resembles a sudden, sharp deterioration.
Exhibit 2: Five Years of Chinese Retail Sales Growth
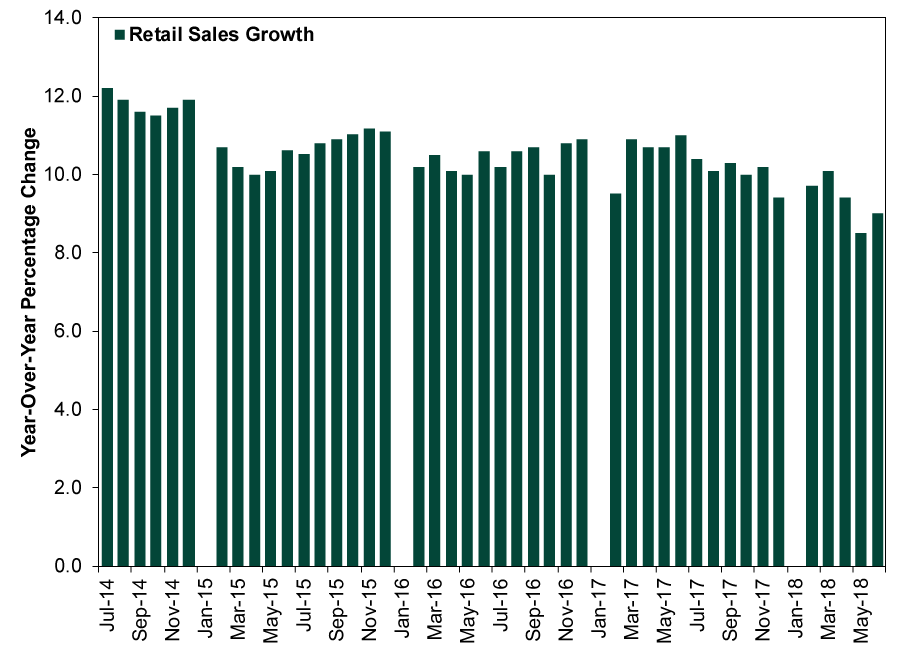
Source: FactSet, as of 7/16/2018. Year-over-year growth in Chinese retail sales, July 2014 – June 2018.
Exhibit 3: Five Years of Chinese Industrial Production Growth

Source: FactSet, as of 7/16/2018. Year-over-year growth in Chinese industrial production, July 2014 – June 2018.
Exhibit 4: Five Years of Chinese Fixed Asset Investment Growth
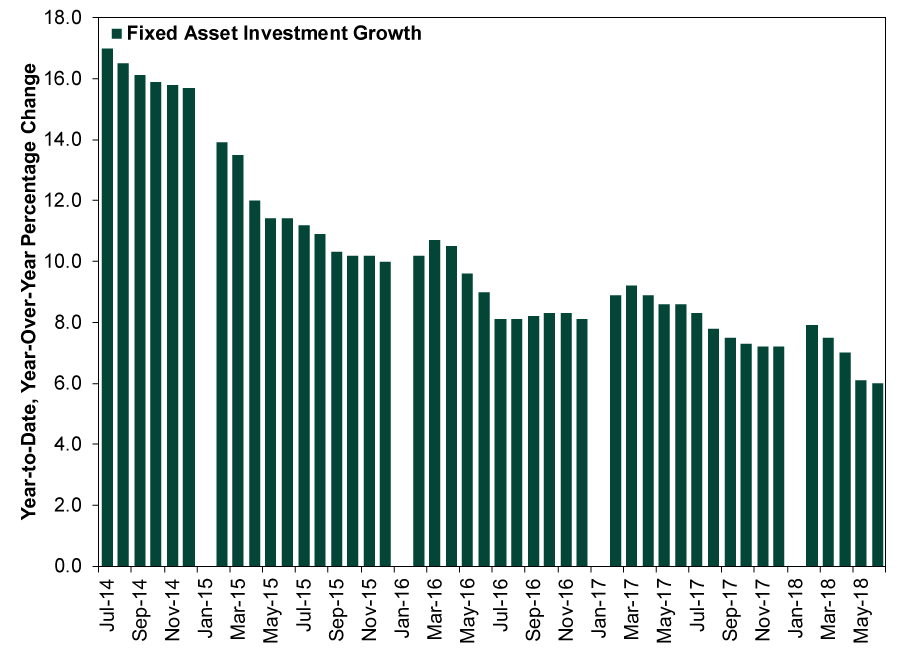
Source: FactSet, as of 7/16/2018. Year-to-date, year-over-year growth in Chinese fixed asset investment, July 2014 – June 2018.
The fixed investment slowdown got perhaps the most ink, with headlines speculating this shows tariffs are starting to bite. But we aren’t buying it. Most fixed investment goes toward infrastructure projects and the like, and infrastructure projects were one of local governments’ favorite means of boosting growth in recent years. Financing these projects was one of the biggest sources of growth in China’s shadow banking system, the beast regulators are presently trying to tame (see Scott Botterman’s recent analysis for more). That effort has resulted in what China calls total social financing—basically loan growth plus the shadow banking system—slowing sharply this year (Exhibit 5). This was always going to hurt the investment categories that depended on shadow financing, namely local infrastructure development and property investment. But retail sales and industrial production rely less on the shadowy corners of financial markets, which we suspect is a reason they have held up better.
Exhibit 5: Five Years of Chinese Total Social Financing
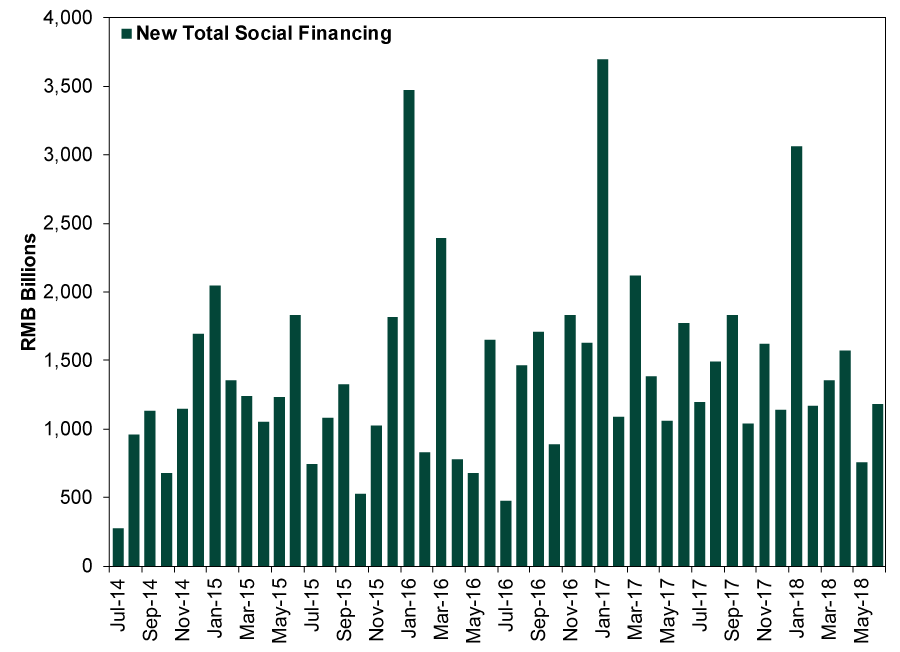
Source: FactSet, as of 7/16/2018. New total social financing in billions of renminbi, July 2014 – June 2018.
As for what comes next, we suspect the answer is, “more of the same.” Fully aware their credit crackdown could cause slower growth, officials took steps to loosen traditional credit markets in recent weeks. (This could also be a desire to shift growth toward easier-to-regulate traditional banks.) They have also jawboned about trying to support industries targeted by the new US tariffs, which sounds to us like veiled, targeted stimulus chatter. Whatever the tactics, Chinese policymakers have a long history of cushioning any slowdown as needed to keep the masses flush with cash and happy, lest they start getting touchy about living under one-party rule. With plenty of firepower in government coffers to keep stimulus flowing where needed, we doubt that changes in the foreseeable future.
If you would like to contact the editors responsible for this article, please message MarketMinder directly.
*The content contained in this article represents only the opinions and viewpoints of the Fisher Investments editorial staff.
Get a weekly roundup of our market insights
Sign up for our weekly e-mail newsletter.

You Imagine Your Future. We Help You Get There.
Are you ready to start your journey to a better financial future?

Where Might the Market Go Next?
Confidently tackle the market’s ups and downs with independent research and analysis that tells you where we think stocks are headed—and why.
Related Resources
-
Market Analysis Business Friendly Bureaucracy or No, Britain is Growing2026-07-16
-
Market Analysis On the June Inflation Cooldown2026-07-14
-
Expert Commentary 3 Things You Need to Know This Week | US Inflation, China GDP, US Retail Sales
 2026-07-13
 -
Weekly Wrap-Up Fisher Investments Reviews: Last Week in Markets—July 6 - July 102026-07-13


Learn More
Learn why 210,000 clients trust us to manage their money and how Fisher Investments and its affiliates may be able to help you achieve your financial goals.
As of 6/30/2026
New to Fisher? Call Us.
Contact Us Today