Personal Wealth Management / Market Analysis
Dr. Copper’s Dubious Diagnoses
Dr. Copper's price is no more predictive of the economy's direction than Dr. Pepper's.

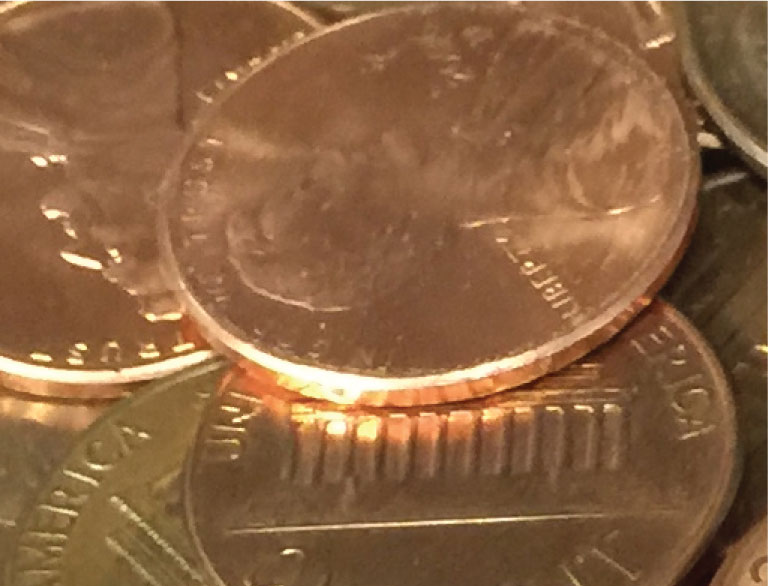
These are mostly zinc, not copper. Photo by Elisabeth Dellinger.
Commodity prices are a function of supply and demand for commodities. Too much of them relative to demand, and prices fall. Too few, and prices rise. Yet for many commodities, mostly metals[i], folks seem to frequently get wrapped up in thinking these moves mean much more. We recently detailed one such commodity-gold. But there is another metal, one that is a little less rare, which some claim has a PhD in economics: Dr. Copper. And copper is plumbing new lows lately, triggering fears over what it all means for growth. However, history suggests copper prices aren't an automatic gauge of growth.
The theory goes a little like this:
- When economies grow, construction, machinery and electricity demand rises.
- Copper is the third-most abundantly produced metal and is used heavily in electronics and building-plumbing, wiring, heating and ventilation-so it is very sensitive to those economic drivers.
- Copper can be profitably shipped relatively easily, so the market is fully global.
- Hence, the theory holds copper prices are a good barometer of the global economy. Rising copper prices signal it is in good shape. Falling prices, not so much.
That all seems perfectly logical, no? And sometimes, it is true enough. For example, in the 2000s' global expansion-underpinned by Emerging Markets (EM) infrastructure build-outs and buoyed to an extent by high levels of US construction activity-demand for copper was strong. And, production was tight. For most of the 1990s, copper prices were down in the doldrums, and investment in mining capacity waned as a result. Hence, when the 2000s expansion saw fast-rising EM demand, it met tight supply. Prices reflected this and rose. The economy grew. Copper during this cycle looked like a good indicator of economic health.
But even within that brief narrative capturing the 2002 - 2007 period is a passage that should raise an eyebrow about copper's predictive powers. That passage is, "For most of the 1990s, copper prices were down in the doldrums." The two bouts of weak commodity prices in the 1990s weren't a harbinger of global recession. They signaled copper supply growth outstripped demand. The false reads are not limited to the 1990s, either. As Exhibit 1 shows, there are a number of periods in post-war US history in which copper prices fell for more than 12 months while the economy grew.
Exhibit 1: Dr. Copper's Incorrect Diagnoses
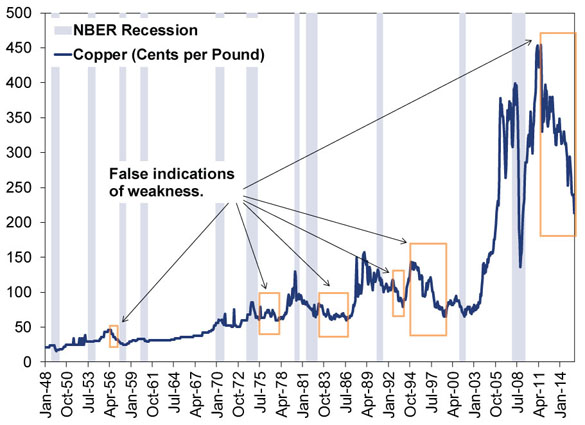
Source: Global Financial Data, as of 11/20/2015. Monthly high-grade copper prices and US recessions, as defined by the National Bureau of Economic Research, America's umpires of recession dates. January 1948 - October 2015.
One of those 12-month periods is ongoing right now-and has been since 2011. Which really isn't all that surprising when you realize that this cycle follows one where commodities prices spiked basically across the board. Miners respond to incentives, rising prices tell producers mining is more profitable-they shout, "Expand production!" But that takes time, so the increased production hits at a lag. Producers therefore have a tendency to overshoot-economics is not an exact science.[ii]Some analysts get it. But others don't and fear falling prices mean doom, an astounding fact considering we've literally seen the opposite for four years running.
Commodity price trends alone don't predict recession because they simply don't account for the factors that result in those prices. You see, falling commodity prices don't mean demand is down. They might mean supply is simply growing faster-like today. In a recession, you would expect prices to drop because of faltering demand. Exhibit 2 depicts refined copper usage by year as a marker of demand, with NBER recessions shaded. Note: Copper demand typically does fall when a recession arrives. However, you wouldn't know at the time because the data are published at a fairly noteworthy lag. And, since stocks tend to lead real economic conditions, this renders copper demand's more accurate signals fairly moot.
Exhibit 2: Dr. Copper's More Correct Diagnoses
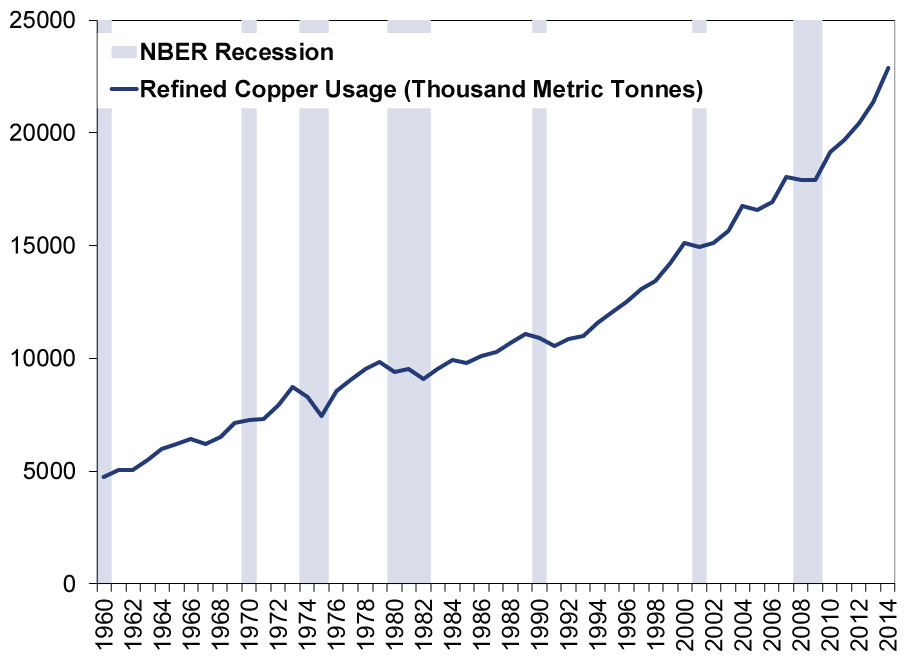
Source: International Copper Study Group, World Copper Factbook 2015 and National Bureau of Economic Research (America's recession-dating umpires). 1960 - 2014.
In a period when services and consumption are leading growth-not infrastructure development or construction-it is fairly likely demand for copper will grow at relatively weaker rates. So it's unsurprising a shift in the world's biggest copper-consuming nation (China) from infrastructure-led growth to services- and consumption-led has laid waste to copper prices. But this again doesn't mean the global economy is markedly and dangerously slowing, considering the economies of the US, most of the developed world and many EMs (including China) are predominantly services-oriented. So in a sense, the copper-falling fears are similar to slowing Chinese industrial production and manufacturing data that spurred false fears in August and September.
Now, none of this is to say we are revoking Dr. Copper's economics doctorate. There are plenty of PhD economists who don't forecast or analyze cyclical conditions at all. Then there are the kind of two-handed economists that Harry Truman famously hated. We guess Dr. Copper could be one of either of those types of economists. Or, on the other hand, Dr. Copper could be a forecaster! Just one that frequently winds up being wrong.
[i] We've never seen anyone claim that pork belly prices are indicative of global economic health, but we are open to that tasty thesis.
[ii]It isn't even a science, actually. But that is an article for another day and our phraseology here is not meant to be read literally, but as a colloquialism.
If you would like to contact the editors responsible for this article, please message MarketMinder directly.
*The content contained in this article represents only the opinions and viewpoints of the Fisher Investments editorial staff.
Get a weekly roundup of our market insights
Sign up for our weekly e-mail newsletter.

You Imagine Your Future. We Help You Get There.
Are you ready to start your journey to a better financial future?

Where Might the Market Go Next?
Confidently tackle the market’s ups and downs with independent research and analysis that tells you where we think stocks are headed—and why.
Related Resources
-
Expert Commentary US Inflation, Fed Minutes, Consumer Sentiment | 3 Things You Need to Know This Week
 2026-04-06
 -
Weekly Wrap-Up Fisher Investments Reviews: Last Week in Markets—March 30 - April 32026-04-06
-
Expert Commentary This Week in Review | Q1 Recap, Earnings Guidance, Elections
 2026-04-03
 -
Market Analysis A Forward-Looking Lesson One Year After Liberation Day2026-04-02


Learn More
Learn why 200,000 clients trust us to manage their money and how Fisher Investments and its affiliates may be able to help you achieve your financial goals.
As of 3/31/2026
New to Fisher? Call Us.
Contact Us Today