Personal Wealth Management / Economics
How Bleak March Data Help Markets Anticipate the Future
Worldwide data are weak, helping shape sentiment towards the immediate future.

Back on March 24, we pointed out the steep drops in March preliminary purchasing managers’ indexes (PMIs, surveys tallying the breadth of growth) as early signs of the economic fallout from society’s COVID-19 response. Friday, the more detailed, final figures emerged—and they were even uglier. When we covered the preliminary gauges, we noted the importance of remembering stocks tend to move before the economy—and this, of course, remains a crucial point now. But the broad reaction to the final figures also illustrates how stocks pre-price data, a point we think is worth considering.
Final PMIs are just a more complete look at the data that underpin Markit Economics’ preliminary version, including more granular looks at individual countries. Hence, we can now see the stark influence of Italy’s lockdown—and how hard-hit Spain has been affected. But we also now have the Institute for Supply Management’s (ISM) US PMI, offering a second look at America. Exhibit 1 shows the final PMIs across a range of major Western nations over the past three months. In all these cases, readings below 50 mean more firms reported contracting activity than expanding (and vice versa).
Exhibit 1: Major Manufacturing and Services PMIs
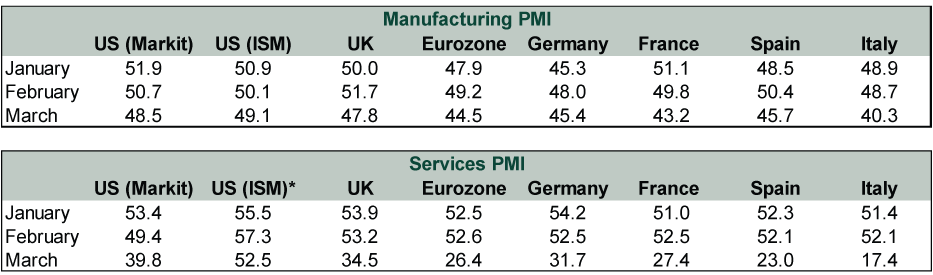
Source: FactSet, as of 4/3/2020. *ISM’s gauge doesn’t directly compare to the others, as it is a non-manufacturing index including industries the others don’t cover, including mining and oil drilling.
Virtually all the final gauges, especially in European services PMIs, were down from the preliminary—to say nothing of the massive declines from February. The services gauges are particularly stark. Considering that most major economies are predominantly services-based, this doesn’t bode well for output. Italian services’ 35-point plunge to an astounding 17.4 reading is the most extreme example, but Spain, France and Germany posted similar drops.
As we noted previously, the manufacturing gauges seem inflated by one component—supplier delivery lag times. In ordinary times, these would signal strong demand—a positive. But these aren’t normal times, and those gauges’ big positive contributions are a negative in disguise. That factor also underpins ISM’s relatively lofty US manufacturing and non-manufacturing readings. The supplier delivery components of these two read 65.0 and 62.1, respectively.[i] A 55.0 reading in order backlogs also inflated the non-manufacturing gauge.[ii] We suspect temporary closures and other business interruptions explain it, not a surge in demand.
Because the US is a few weeks behind Europe in seeing the full effects of COVID-19 and the related closures, it is highly likely the relative strength in America’s PMIs versus Europe’s will fade in April’s data. Market participants will probably base their expectations off these European data, using them to conjure a loose range around a consensus estimate that also accounts for how the situation evolves in America. They will extrapolate them toestimate other things—like analysts at Markit did today in noting that eurozone PMI readings translate to a -10% annualized GDP decline.
Now, we don’t think those output extrapolations are necessarily correct, mind you. PMIs measure only growth’s breadth, and GDP measures the magnitude of output. But that isn’t the point. Rather, these opinions, views and studies help forge the investing public’s view of what data will look like. Market participants act on these views in real time—that is how markets effectively anticipate economic conditions before any data even hint at them.
To think forward, we believe you must think like markets. Upcoming data are likely to be bad, if not very bad. But by the time they come, markets will likely have weighed that view, underpinned by early hints like today’s PMI readings. Eventually— and perhaps it has already happened—those expectations will be worse than a less-bad-than-expected reality that follows. That is a key part of the formula for a new bull market to begin.
If you would like to contact the editors responsible for this article, please message MarketMinder directly.
*The content contained in this article represents only the opinions and viewpoints of the Fisher Investments editorial staff.
Get a weekly roundup of our market insights
Sign up for our weekly e-mail newsletter.

You Imagine Your Future. We Help You Get There.
Are you ready to start your journey to a better financial future?

Where Might the Market Go Next?
Confidently tackle the market’s ups and downs with independent research and analysis that tells you where we think stocks are headed—and why.
Related Resources
-
Weekly Wrap-Up Fisher Investments Reviews: Last Week in Markets—May 11 - May 152026-05-18
-
Behavioral Finance Investing Lessons From the Indianapolis Motor Speedway2026-05-18
-
Expert Commentary 3 Things You Need to Know This Week | Global Inflation, Fed Minutes, US Sentiment2026-05-18
-
In The News Around the World in Tax Policy Talk2026-05-15


Learn More
Learn why 200,000 clients trust us to manage their money and how Fisher Investments and its affiliates may be able to help you achieve your financial goals.
As of 3/31/2026
New to Fisher? Call Us.
Contact Us Today