Personal Wealth Management / Market Analysis
Lessons From the 10th Anniversary of the Last Bull Market’s Peak
It can be hard to fathom in the depths of a crisis, but bull markets follow bear markets and often erase the declines sooner than most anticipate.

10 years ago today, markets peaked, and one of history's worst bear markets began. At the time, there was little hint of the panic to come. Declines were gentle, and banks weren't yet taking huge (and unnecessary) balance sheet writedowns. But a year later, as the fallout from banks' having to mark illiquid securities to the most recent (fire-sale) price grew worse and the US Fed and Treasury botched the crisis response, panic was spreading. Autumn 2008 and winter 2009 were harrowing for most investors. From peak to the March 9, 2009 trough, the S&P 500 Index fell 55.3%.[i] In the darkest days, some felt like stocks would never rise again. Many feared their investment goals were finished. Yet 10 years later, stocks have erased the decline and then some. Even with that bear market, the S&P 500 is up 102.2% over the past 10 years.[ii] While that doesn't make the memories of the bear any less painful, it does highlight a key lesson: If you have a long time horizon, staying invested through bear markets shouldn't put your long-term goals out of reach.
This was hard for many to grasp during the bear's depths. Since the last true financial panic occurred in 1930 during the Great Depression, most US investors in 2008 had never experienced one. Ten years on, it might be hard to grasp what sentiment was like-emotional scar tissue can blunt memories. But it was wild. Stocks would swing down big one day, then bounce high the next as speculators scrambled to cover short positions-and then tank again on day three. The volatility was gut-wrenching, and it seemed like anything-or nothing-could trigger it. Some folks worried the entire stock market could go to zero. Investors fled en masse, desperate to exchange stocks for anything that seemed less susceptible to the madness-cash, bonds, gold, annuities, you name it. Yet while this might have felt better immediately, it overlooked a simple truth: Bull markets follow bear markets. It's often darkest just before the dawn.
In our view, losing sight of this can be dangerous. Depending on an investor's time horizon and cash flow needs, participating in a bear isn't necessarily devastating. However, abandoning stocks after participating in a bear's deep declines locks in losses, and it raises the risk stocks snap back before you get back in. In the industry vernacular, you could get whipsawed.
Participating in bear markets needn't be a permanent setback, provided you also participate in bull markets. This is also hard for many to fathom: When this bull market began in 2009, many feared a "new normal" of below-average stock returns. Since it takes a higher percentage gain to offset a given loss, a "new normal" recovery raised the specter of going decades without recouping losses. Even if you didn't buy the "new normal" idea and were considering only stocks' average annualized return (around 10% since 1926),[iii] you might still have expected to take a decade or more to recover fully. But average returns include all bear markets, and most of the time, stocks' actual annual returns are more extreme than the long-term average. Gains often come in clumpy patches-and since bear markets usually end with a V-shaped rebound, some of the biggest clumps can occur early in a bull, speeding the time to recovery and surprising many. For instance, from the March 9, 2009 trough through yearend, the S&P 500 gained 68%.[iv] Other recoveries have bounced fast and high, too-with new market records coming a within a few years, sometimes months.
Exhibit 1: US Stocks' Rebound After August 1987 - December 1987 Bear Market
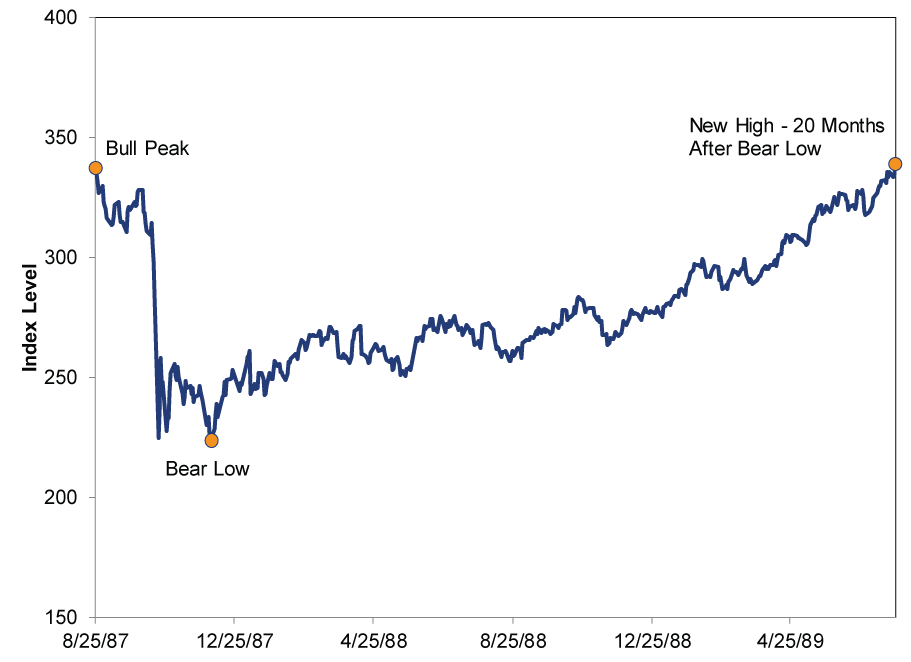
Source: FactSet, as of 10/6/2017. S&P 500 daily price returns, 8/25/1987 - 7/26/1989. Price returns used in lieu of total due to data availability.
Exhibit 2: US Stocks' Rebound After July 1990 - October 1990 Bear Market
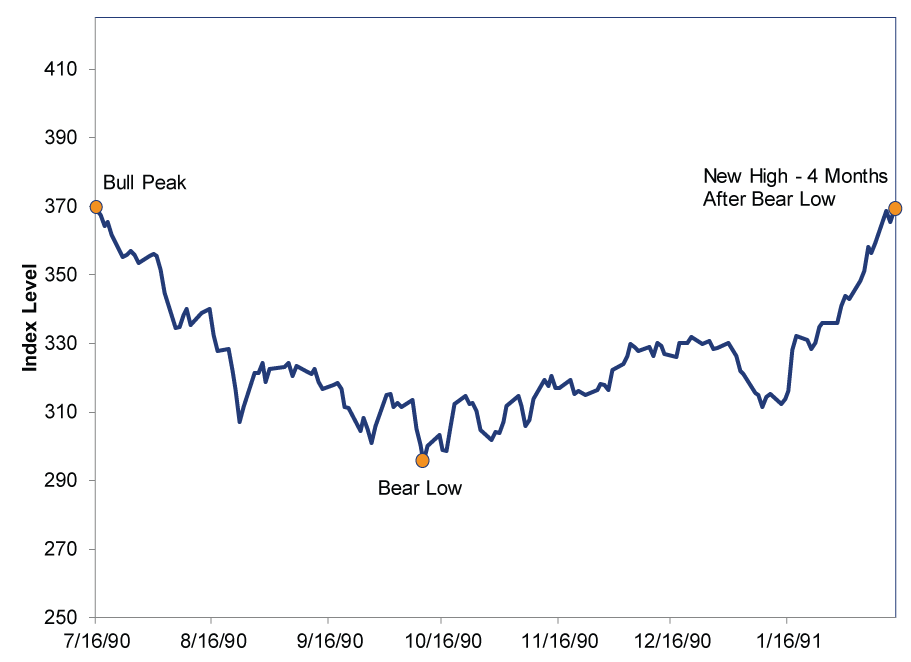
Source: FactSet, as of 10/6/2017. S&P 500 daily price returns, 7/16/1990 - 2/13/1991.
Exhibit 3: US Stocks' Rebound After 2000 - 2002 Bear Market
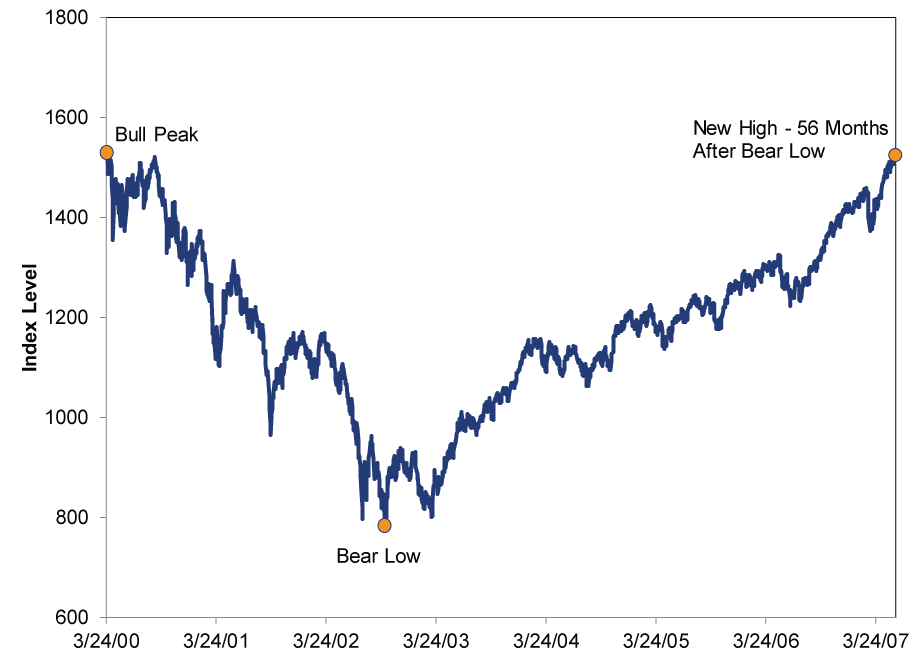
Source: FactSet, as of 10/6/2017. S&P 500 daily price returns, 7/16/1990 - 2/13/1991.
Exhibit 4: US Stocks' Rebound After 2007 - 2009 Bear Market
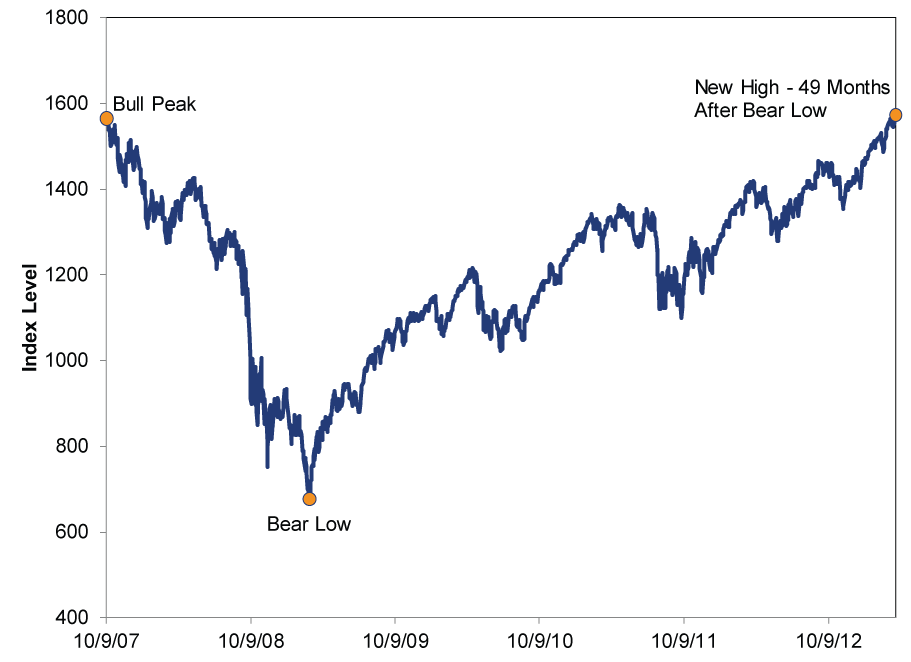
Source: FactSet, as of 10/6/2017. S&P 500 daily price returns, 10/9/2007 - 3/28/2013.
The current bull took about four years to pass the prior peak, as Exhibit 4 shows. (Factoring in dividends shaves this to three years.) Four years might seem like a long time as you're living it, but if you're investing for the next 15, 20, 30 or more years, it looks relatively shorter.[v]
This is why we believe the time to act is early in a bear-or not at all. Signs of an early-stage bear-a major, long market decline of -20% or greater-include cresting euphoria that ignores deteriorating fundamentals, or an unseen, multitrillion dollar negative suddenly walloping the global economy and stocks. Because these drivers are fundamental, we think they're possible to spot, making it possible to avoid a chunk of the decline if you identify a bear early enough. (Not so with corrections-shorter, sharper, -10% - 20% declines that come and go without warning.) We don't think it's required if you're investing for long-term growth, but it can help. But the key is identifying a bear market shortly after it forms. After stocks have endured significant declines, we generally think the risks of getting out outweigh the risks of staying in.
Now, this doesn't mean there is a cookie-cutter approach for all investors. What is right for you always depends on your unique circumstances, time horizon, cash flow needs and goals. But for investors whose time horizons are sufficiently long and who don't have high cash flow needs, experiencing bear markets doesn't have to be a permanent setback. Bull markets follow bears, and they have historically outweighed bear markets in length and magnitude. Bears loom large in memory because they're so emotionally painful, but they don't loom so large in stocks' long-term returns.
[i] Source: FactSet, as of 10/6/2017. S&P 500 Total Return Index, 10/9/2007 - 3/9/2009.
[ii] Source: FactSet, as of 10/9/2017. S&P 500 Total Return Index, 10/9/2007 - 10/6/2017.
[iii] Source: Global Financial Data, Inc., as of 10/6/2017. S&P 500 Total Return Index, 1926 - 2016.
[iv] Source: FactSet, as of 10/6/2017. S&P Total Return Index, 3/9/2009 - 12/31/2009.
[v] The counterpoint to all of this is the post-Depression era, but it's important to consider the entire history. For one, the S&P 500 fell -86% from September 1929 to June 1932-the deepest decline on record. A bull market ensued, but even a 324% rise off the bottom wasn't enough to get stocks back to breakeven by the time the bull ended in March 1937. We think that bull was walloped early, before sentiment could run its full course, as one major contributor was the Fed's decision to jack up reserve requirements, which caused a severe monetary contraction. A nascent recovery appeared to be underway by early 1938, but it got cut short when Hitler annexed the Sudetenland, making his territorial ambitions clear and forcing stocks to start pricing in the devastating global conflict World War II would become. The bear market eventually ended in April 1942, after a 60% decline. The four-year bull market that followed didn't get stocks back to breakeven, and they wouldn't get there until September 1954. So yes, it took 25 years to go from peak to new high, but it also involved the worst decline ever, a Fed error and a world war. (Source: Global Financial Data, as of 10/6/2017.)
If you would like to contact the editors responsible for this article, please message MarketMinder directly.
*The content contained in this article represents only the opinions and viewpoints of the Fisher Investments editorial staff.
Get a weekly roundup of our market insights
Sign up for our weekly e-mail newsletter.

See Our Investment Guides
The world of investing can seem like a giant maze. Fisher Investments has developed several informational and educational guides tackling a variety of investing topics.
Related Resources
-
Politics France Falls Into Political Purgatory … Again2025-09-12
-
Expert Commentary Fisher Investments Reviews Fed Rate Cuts2025-09-12
-
Market Analysis Putting Stagflation Claims in Actual Context2025-09-11
-
Expert Commentary Should Investors Hold Cash on the Sidelines?2025-09-11


Learn More
Learn why 185,000 clients* trust us to manage their money and how we may be able to help you achieve your financial goals.
*As of 6/30/2025
New to Fisher? Call Us.
Contact Us Today