Personal Wealth Management / Market Analysis
Pundits Search For Meaning in Bumpy Bond Yields
We would suggest patience before you buy into the theory a bond bear looms.

Here is a fun factoid: Since April 20, German 10-year bond yields have risen 1100%. Yes, we know "percent of a percent" calculations are ridiculous, and "German bond yields rose over 55 bps or about a half a percentage point" is a far better way to say it. But the extreme has so much flair-just like all those headlines warning the oft-feared, rarely seen bond bubble has popped, ushering in a fixed income bear market. And hey, anything is possible, though the handwringing seems a tad hasty. Bond markets are subject to volatility, just like stocks-for any or no reason-and yields can swing wildly in the short term. But longer term, bonds move on supply and demand, and current fundamentals don't point to a sustained, significant rise in long-term rates. We suspect the latest wobbles are just part of the bouncy, directionless drift we've seen year to date.
Yes, bonds have sold off across the Western world, and most yields are up sharply. When yields rise, bond prices fall, and Bloomberg estimates that falling amounts to about $430 billion in price declines globally since the bloodletting began. Exhibit 1 has a picture.
Exhibit 1: 10-Year Yields Over the Last Month
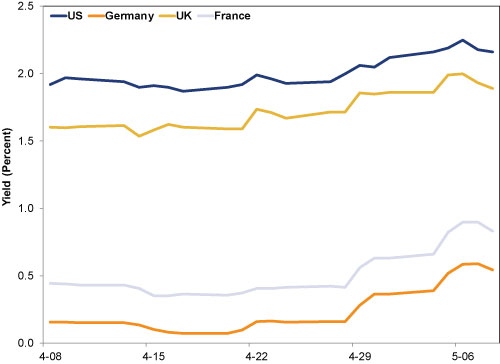
Source: FactSet, as of 5/11/2015. 10-Year US, German, UK and French bond yields 4/8/2015-5/8/2015.
But given more context, the past three weeks don't look so odd. Exhibit 2 shows yields since the year began-lots of sideways bouncing. For all the talk of spikes, yields are about where they started this year.
Exhibit 2: 10-Year Yields Year to Date in 2015
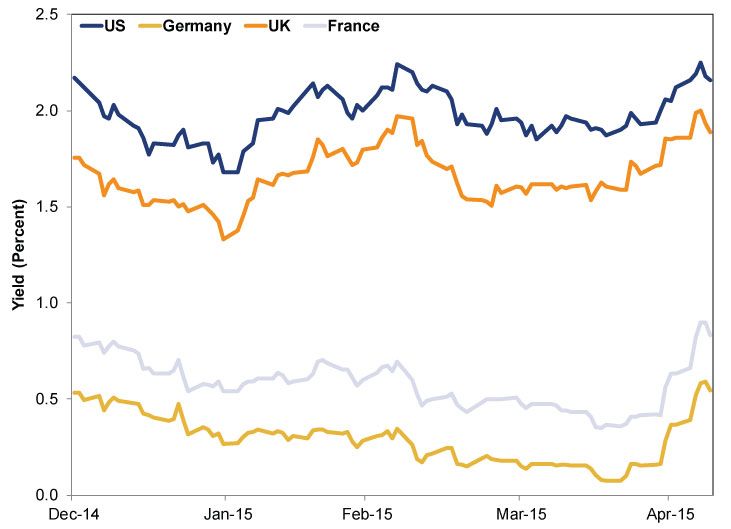
Source: FactSet, as of 5/11/2015.
Just as we would suggest investors not draw sweeping conclusions from a few weeks of stock volatility, three weeks isn't enough time to conclude anything about bonds. Particularly since-for all the talk about multi-decade bond bulls and bears-frequent ups and downs are normal. Illusions otherwise seem to stem from the US and UK's super-high rates in the late 1970s and early 80s, as both nations sought to tame double-digit inflation. Hence bond markets look like one long slow journey from low rates to high in the 1950s, 60s and 70s-and one long journey back down since the early 1980s. That created the perception bond markets move in really, really long cycles. (Though there were many up-and-down cycles along that path too.)
Exhibits 3: 10-Year Bond Yields and 10-Year Gilt Yields
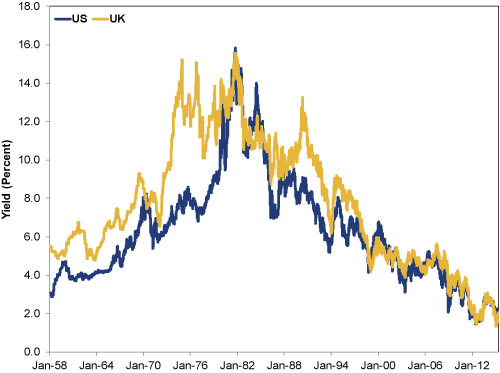
Source: US: St. Louis Fed, as of 5/12/2015. Monthly 10-Year yields January 1958 - December 1961, daily yields 1/1/1962 - 5/8/2015. UK: Global Financial Data, as of 5/11/2015. Monthly 10-Year gilt yields January 1958 - December 1978 and daily yields 1/1/1979 - 5/8/2015. Bank of England and FactSet, as of 5/12/2015. Daily yields 11/15/2012 - 12/4/2012 and 11/3/2014 - 11/20/2014.
Look really far back in history, however, and the 1970s and 1980s are the exception, not the rule. Sideways-bouncing rates were the norm for much of history. Centuries-old data are hard to find, but the UK Treasury kept good track of the open-ended debt issued to finance bailouts after the South Sea Company burst-the note that eventually became known as the 2 ½% Consolidated Loan. Until those misadventures with price caps in the mid-20th century drove inflation sky-high, its market yield bounced along in a four percentage point bandwidth. (Exhibit 4)
Exhibit 4: 2 ½% Consolidated Stock Annual Gilt Yields 1727 - 2014
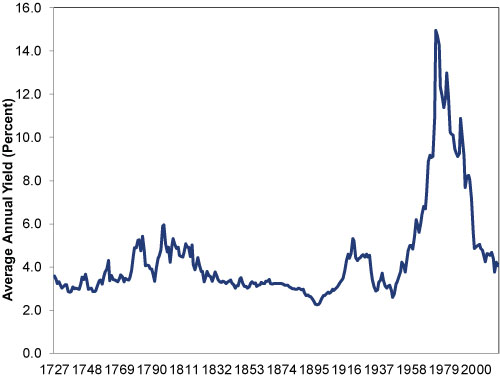
Source: UK Debt Management Office.
Yale economist Robert Shiller made a similar point in Project Syndicate in March , where he examined historical US yields:
Bond-market crashes have actually been relatively rare and mild. In the US, the biggest one-year drop in the Global Financial Data extension of Moody's monthly total return index for 30-year corporate bonds (going back to 1857) was 12.5% in the 12 months ending in February 1980. Compare that to the stock market: According to the GFD monthly S&P 500 total return index, an annual loss of 67.8% occurred in the year ending in May 1932, during the Great Depression, and one-year losses have exceeded 12.5% in 23 separate episodes since 1900.
It is also worth noting what kind of event is needed to produce a 12.5% crash in the long-term bond market. The one-year drop in February 1980 came immediately after Paul Volcker took the helm of the Federal Reserve in 1979. A 1979 Gallup Poll had shown that 62% of Americans regarded inflation as the "most important problem facing the nation." Volcker took radical steps to deal with it, hiking short-term interest rates so high that he created a major recession. He also created enemies (and even faced death threats). People wondered whether he would get away with it politically, or be impeached.
As far as we can tell, there are no analogous events on this horizon today. Some speculate German yields spiked because investors are worried a Greek default and eurozone exit would force the recapitalization of the European Financial Stability Facility, which owns €142 billion of Greek debt, triggering a big increase in bond supply. Possible, of course, but highly speculative. It does seem fair to say rising inflation expectations are playing a role, given yields' late-2014 fall coincided with falling headline inflation in the eurozone-and correlated pretty strongly with oil (Exhibit 5). Now that oil prices have crept higher (particularly in Europe, where the weak euro jacks up imported fuel prices) and last year's much higher prices are about to start falling out of the base comparison, folks rationally expect inflation to tick up some. That's apparent from market-based indicators like the spread between 10-Year Treasury yields and 10-Year Treasury Inflation Protected Securities (TIPS), which widens as investors demand more compensation to offset expected price increases. (Exhibit 6)
Exhibit 5: Oil Price & Treasury Yields
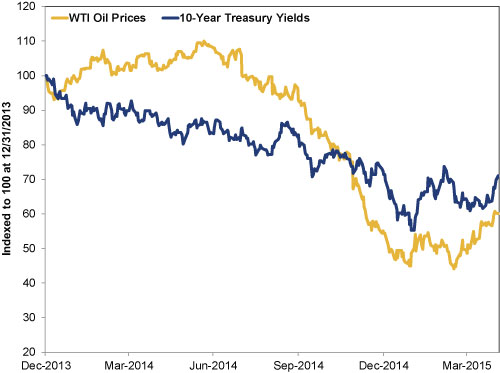
Source: St. Louis Fed, as of 5/12/2015.
Exhibit 6: 10-Year Treasury/10-Year TIPS Spread
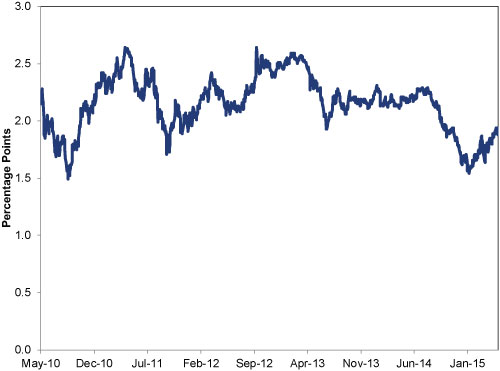
Source: St. Louis Fed, as of 5/11/2015. US 10-Year Treasurys Constant Maturity and 10-Year Treasury Inflation-Indexed Security, Constant Maturity 5/7/2010 - 5/7/2015.
But a modest uptick in inflation simply justifies modestly higher rates-not the unstoppable surge folks fear. Nor do other supply and demand drivers seem to support wildly higher yields. EFSF concerns aside, issuance remains low thanks to Germany's budget surplus and falling deficits in much of the developed world. Nearly $1.5 trillion in US and UK bonds remains locked up on the Fed's and BoE's balance sheets. Strict capital requirements have driven bank demand sky-high. Those drivers would seem to counterbalance the so-called "reflation trade" and expectations of faster economic growth looking ahead.
While bond markets might be caught in a tug-of-war between forces favoring higher and lower rates, they can still play a fine role in a blended stock/bond portfolio, depending on your long-term goals. While the bouncing might seem to cut against bonds' traditional purpose (mitigating expected short-term volatility relative to an all equity portfolio), a shorter-duration portfolio will bounce less-shorter-term yields are less interest rate sensitive. Corporate bonds should do well, too, as yield spreads between them and US Treasurys narrow.
In short: Stay cool and don't panic out of bonds if you need them to reach your long-term goals. While the potential for rates to rise some is there, it's unlikely to become the utter disaster some presume. Rumors of a bubble's existence, never mind its impending demise, seem greatly exaggerated.
Stock Market Outlook
Like what you read? Interested in market analysis for your portfolio? Why not download our in-depth analysis of current investing conditions and our forecast for the period ahead. Our latest report looks at key stock market drivers including market, political, and economic factors. Click Here for More!
If you would like to contact the editors responsible for this article, please message MarketMinder directly.
*The content contained in this article represents only the opinions and viewpoints of the Fisher Investments editorial staff.
Get a weekly roundup of our market insights
Sign up for our weekly e-mail newsletter.

You Imagine Your Future. We Help You Get There.
Are you ready to start your journey to a better financial future?

Where Might the Market Go Next?
Confidently tackle the market’s ups and downs with independent research and analysis that tells you where we think stocks are headed—and why.
Related Resources
-
Market Analysis What the Latest Global Flash PMIs Reveal2026-03-31
-
Market Analysis Beyond Iran: A Non-Conflict March Mailbag Q&A2026-03-30
-
Weekly Wrap-Up Fisher Investments Reviews: Last Week in Markets—March 23 - March 272026-03-30
-
Expert Commentary US Jobs, Eurozone Inflation, Private Credit | 3 Things You Need to Know This Week
 2026-03-30


Learn More
Learn why 195,000 clients trust us to manage their money and how Fisher Investments and its affiliates may be able to help you achieve your financial goals.
As of 12/31/2025
New to Fisher? Call Us.
Contact Us Today