Personal Wealth Management / Economics
Rising Gas Prices Shouldn’t Stall the Economy
Rising gas prices may fuel economic fear—and annoy drivers—but they don’t harm overall economic growth.

Just in time for summer road trips, gas prices are on the rise. Whenever this happens, folks tend to fret fuel expenses eating into their monthly budgets. Many also wonder about its implications for the economy—and right on cue, we have seen a fair amount of fearful headlines in recent days. But while paying more at the pump isn’t pleasant, for the economy overall, spending on gas is still consumer spending that contributes to economic growth. Pricier gas isn’t happy, but the economic and stock market impact is far less than many think.
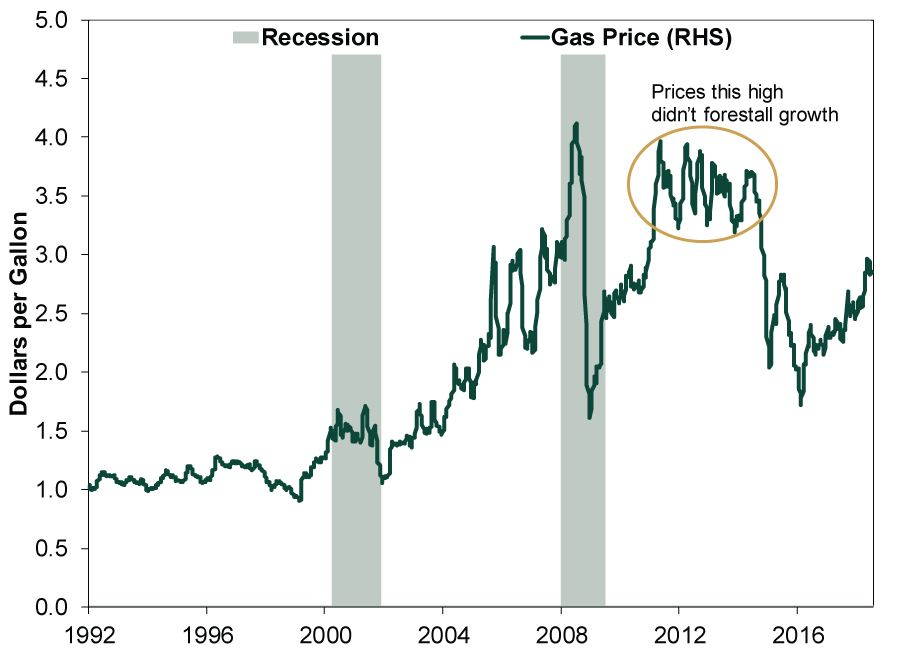
From the US national average low of $1.72/gallon February 2016 to its recent $2.96 high in May, gas prices have risen 72.1%.[i] Seems like a lot! Some analysts think if they rise closer to $4, economic trouble will follow. They point to rising gas prices in 2000 and 2008 and say they corresponded with subsequent recessions, but that would be cherry-picking. The coincidence of rising gas prices and stock market peaks means nothing without causation, and gas prices had basically nothing to do with the bursting Tech Bubble (2000) or the imposition of mark-to-market accounting on banks’ illiquid, held-to-maturity assets, which led to 2008’s financial crisis. Gas prices nearly tripled from 2002 to 2006, but that didn’t stop a bull market from beginning in October 2002 and running until October 2007. Gas also tripled from 2009 to 2011, and recession didn’t ensue. The economy fared fine while gas was solidly above $3 from March 2011 to October 2014.[ii] Moreover, the recent rise is coming off levels that were low relative to recent history, tied to 2014’s oil price crash.
Exhibit 1: Gas Prices and Growth
Source: Federal Reserve Bank of St. Louis, as of 7/18/2018. US regular all formulations gas price, dollars per gallon, weekly, not seasonally adjusted, 1/6/1992 – 7/16/2018.
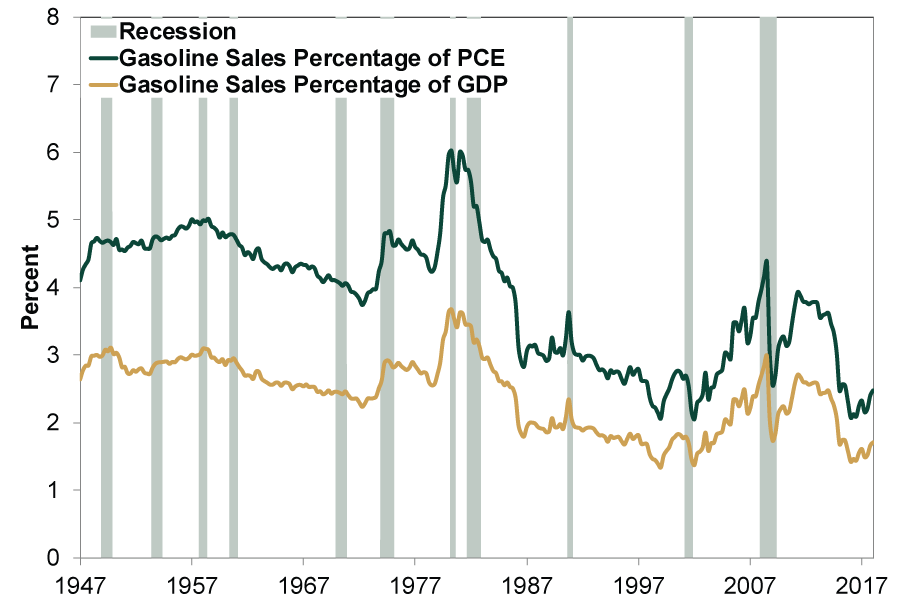
Americans just don’t spend that much filling their tanks. Gas sales are just 2.5% of total consumer spending and, as a percentage of GDP, they are still lower at 1.7%.[iii] This spending happens to be counted in GDP. (Exhibit 2) Higher prices might redirect some discretionary spending to gas, but they don’t necessarily change total consumption. When gas prices fell a lot mid 2014 – early 2016, folks spent less at the pump—freeing them to spend elsewhere—but it didn’t boost overall consumption. In 2014, as gas prices rolled over, the average American driver spent about $1,567 filling up.[iv] By 2016, it was $1,384.[v] Folks’ wallets were fatter, but the low oil prices that drove gas down pummeled US business investment, weighing on GDP. If cheaper gas didn’t bring a boom, it seems hard to argue pricier gas will bring doom.
Exhibit 2: Gas Sales Small Part of Consumer Spending and GDP
Source: Federal Reserve Bank of St. Louis, as of 7/16/2018. Personal consumption expenditures: Nondurable goods: Gasoline and other energy goods percent of personal consumption expenditures and GDP, Q1 1947 – Q1 2018.
Some also fear rising gas prices will lead to higher inflation and Fed hikes. But gas prices aren’t a big part of the consumer price index (CPI)—4.4% as of May 2018. Moreover, inflation is prices rising broadly across the economy, not in one commodity-exposed, volatile category. The Fed also has a long history of seeing through gas price swings, viewing them as transitory. This is probably because inflation is always and everywhere a monetary phenomenon—when broad money supply grows faster than output. M4 money supply is currently growing about 4.5% y/y, slower than in recent years, implying moderate inflation for the foreseeable future.[vi] Although there is no way to predict how the Fed will react to economic data, they still have room to hike rates without inverting the yield curve.
Many see the economy running on fumes, but that sets up opportunity for investors. False fears fire up stocks as more folks fathom fuel aplenty is left in the tank.
[i] Source: Federal Reserve Bank of St. Louis, as of 7/16/2018. US regular all formulations gas price, dollars per gallon, weekly, not seasonally adjusted, 2/15/2016 – 5/28/2018.
[ii] Ibid. US regular all formulations gas price, dollars per gallon, weekly, not seasonally adjusted, 3/7/2011 – 10/27/2014.
[iii] Ibid. Personal consumption expenditures: Nondurable goods: Gasoline and other energy goods as a percent of personal consumption expenditures and GDP, Q1 1947 – Q1 2018.
[iv] Source: US Energy Information Administration, US Department of Transportation and Federal Reserve Bank of St. Louis, as of 7/16/2018. U.S. product supplied for finished motor gasoline, gallons, divided by licensed drivers and multiplied by US regular all formulations gas price, dollars per gallon, annual average, 2014.
[v] Ibid. 2016.
[vi] Source: Center for Financial Stability, as of 7/17/2018. Divisia M4, year-over-year growth in May 2018.
If you would like to contact the editors responsible for this article, please message MarketMinder directly.
*The content contained in this article represents only the opinions and viewpoints of the Fisher Investments editorial staff.
Get a weekly roundup of our market insights
Sign up for our weekly e-mail newsletter.

You Imagine Your Future. We Help You Get There.
Are you ready to start your journey to a better financial future?

Where Might the Market Go Next?
Confidently tackle the market’s ups and downs with independent research and analysis that tells you where we think stocks are headed—and why.
Related Resources
-
Market Analysis Beyond Iran: A Non-Conflict March Mailbag Q&A2026-03-30
-
Weekly Wrap-Up Fisher Investments Reviews: Last Week in Markets—March 23 - March 272026-03-30
-
Expert Commentary US Jobs, Eurozone Inflation, Private Credit | 3 Things You Need to Know This Week
 2026-03-30
 -
Expert Commentary This Week in Review | Iran Conflict Volatility, March PMIs, Gold’s Recent Sell-Off
 2026-03-27


Learn More
Learn why 195,000 clients trust us to manage their money and how Fisher Investments and its affiliates may be able to help you achieve your financial goals.
As of 12/31/2025
New to Fisher? Call Us.
Contact Us Today