Personal Wealth Management / Market Analysis
Why Inflation Doesn’t Seem Set to Zoom
Contrary to present worries, “cost-push” inflation isn’t a thing—and prices don’t appear poised to zoom anytime soon.

Is inflation stalking the US economy? The data seem to hint as much: On a year-over-year basis, the Consumer Price Index (CPI) has now risen each month this year, from December’s 2.1% y/y to May’s 2.7%. Core CPI (which excludes the volatile food and energy categories) has done the same, ticking up from 1.8% y/y in December to 2.2% in May. Meanwhile, a big May bump in businesses’ input costs (3.1% y/y versus 2.6% in April)—the highest year-over-year reading in nearly six and a half years—has fueled fears higher prices haven’t finished rippling through the economy, stinging consumers and potentially forcing the Fed to further raise interest rates and cool the expansion. Sure enough, the Fed hiked rates in its Wednesday meeting—perhaps a sign they are “preparing to take the gloves off in [their] fight against accelerating inflation.” But examining where inflation actually comes from suggests surging prices aren’t about to loom over markets.
Underlying current fears is a theory called “cost-push” inflation—the idea higher commodity and other input costs (including trade tariffs) eventually lead companies to raise prices on final products—voilà, inflation. But this logic presumes firms can set prices wherever they like while consumers merely grumble and pay up. This is characteristic of monopolies, not competitive markets with an abundance of sellers battling it out on (among other things) price—which describes the vast majority of the US economy presently. Overwhelmingly, supply and demand in the end market rule, with prices fluctuating primarily based on what consumers are willing and able to pay. Moreover, if businesses could raise prices at will, why would they bother waiting for higher input costs to do so?
Of course, some companies do pass on higher prices to consumers—when the market allows it. This frequently garners headlines—like when popular fast food chains whose names sound kind of like BrickDonald’s and Flipotle announce higher costs are forcing price increases. This may make folks a little hangry, but it isn’t inflation. Higher prices on select goods isn’t the same as a broad price increase across the entire economy. Spotlighting price-hikers can be misleading, too, as in any month, some prices rise as others fall. For example, those on household furnishings and used cars fell in May—but that isn’t deflation, any more than May’s rising medical care, tobacco and new car prices is inflation. Plus, about 60% of the CPI basket is services, which are less vulnerable to rising input costs. Truckloads of raw materials aren’t necessary to prepare taxes or cut hair.
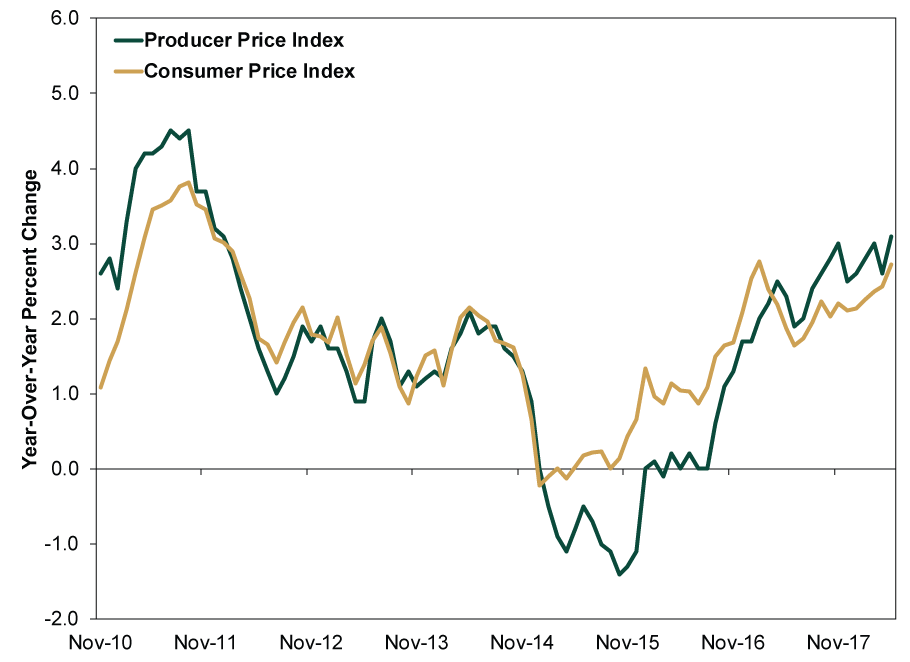
If cost-push inflation were real, changes in producer prices would precede parallel inflation moves. But history shows this isn’t so. Per Exhibit 1, the former moves in step with headline inflation, making it what we in the biz call a “coincident” indicator.
Exhibit 1: Producer Prices Fluctuate Alongside Economy-Wide Prices
Sources: Federal Reserve Bank of St. Louis and the Bureau of Labor Statistics, as of 6/13/2018. Year-over-year percent change in the Consumer Price Index for All Urban Consumers: All Items, and the Producer Price Index for Final Demand: Finished Goods, November 2010 – May 2018.
Besides, May’s higher CPI reading may prove transient, as it stems in part from a big early 2017 fall in cell phone and doctor fees distorting the year-over-year calculation.
Wiggles in individual products and services aside, inflation’s root (as Milton Friedman taught) is too much money chasing too few goods. Money supply and demand, in short. Thanks to the miracle of fractional reserve banking, banks create most new money supply by lending. If Betty’s Bank accepts $100 from Peter and lends $90 of it to Paul, money supply is now $90 higher. If Paul then deposits his $90 at Sally’s Savings & Loan, which lends out another big chunk, etc., the process keeps going. Banks don’t have to lend out all their deposits though—it has to make business sense. This is where the yield curve comes in. Banks’ business model is borrowing short term (i.e., from depositors) and lending long (i.e., to businesses and homebuyers). The difference is effectively their profit margin. A steep yield curve—materially higher interest rates on long-term debt than short-term—encourages banks to lend eagerly, while a flatter yield curve cuts into profits.
If the yield curve is steep and lending growth is speedy, the result is broad, economy-wide price increases—not higher prices in some select product groups that eventually leak into others. Presently, bank lending isn’t on a tear, and the US yield curve, while still upward-sloping, is near its flattest of this expansion. Just got flatter after Wednesday’s rate hike! In addition to lifting the short end of the curve 0.25 percentage point, Fed hikes tend to reduce inflation expectations by signaling to markets the Fed won’t let the economy run hot. Since inflation expectations are a key determinant of long rates, this flattens the yield curve further, discouraging bank lending—that money supply engine.
How many times the Fed hikes again this year—a hot topic—is unknowable. Fed board members’ “dot plot”—which shows their respective fed-funds rate forecasts for 2018 and beyond—hints board members believe they will. But it isn’t a blueprint. All Fed decisions, as board member John Williams’ collectible t-shirt makes clear, are “data dependent”—basically code for “we have no clue what will happen and will decide what to do later, but we will definitely look at some data first.” We believe investors should heed new Fed chair Jerome Powell: The Fed’s “forward guidance” on future potential hikes isn’t helpful. Their most recent (and much shorter) policy statement had none—a refreshing change.
But more rate hikes, should they come, would weigh further on inflation expectations. With 1.28 percentage points currently between overnight and 10-year rates, the Fed can hike without inverting the yield curve.[i] Global economic fundamentals remain positive for this and other reasons and sentiment is still broadly tempered—a bullish cocktail. In this growthy environment, we don’t think recent upticks in consumer and producer prices rate as market risks.
[i] Source: Federal Reserve Bank of St. Louis, as of 6/15/2018. 10-year US Treasury yield (constant maturity) minus the Effective Federal Funds Rate on 6/13/2018.
If you would like to contact the editors responsible for this article, please message MarketMinder directly.
*The content contained in this article represents only the opinions and viewpoints of the Fisher Investments editorial staff.
Get a weekly roundup of our market insights
Sign up for our weekly e-mail newsletter.

You Imagine Your Future. We Help You Get There.
Are you ready to start your journey to a better financial future?

Where Might the Market Go Next?
Confidently tackle the market’s ups and downs with independent research and analysis that tells you where we think stocks are headed—and why.
Related Resources
-
Expert Commentary This Week in Review | Iran Conflict Volatility, March PMIs, Gold’s Recent Sell-Off
 2026-03-27
 -
Market Analysis Will Lower Capital Requirements Send Banks Higher?2026-03-26
-
Politics This Week in Gridlock: Europe Edition2026-03-26
-
Expert Commentary Ken Fisher on Measuring Inflation, Currency Reset, Commodities, and more2026-03-25


Learn More
Learn why 195,000 clients trust us to manage their money and how Fisher Investments and its affiliates may be able to help you achieve your financial goals.
As of 12/31/2025
New to Fisher? Call Us.
Contact Us Today