Personal Wealth Management / Economics
Scaling and the Treasury's Tariff Take
Customs revenues have jumped, but they remain minimal relative to imports.

The Treasury’s monthly statement for May hit the wires Thursday, driving about a bazillion headlines about the surging budget deficit, which jumped 39% in fiscal 2019’s first eight months versus the same period in fiscal 2018 (the Treasury’s fiscal year runs October 1 – September 30). Most coverage was sure to note that customs duties collected also soared, up 80.9% year to date from fiscal 2018’s first eight months. Sounds huge! Yet this factoid doesn’t give one a real sense of how big a bite tariffs are taking out of economic activity. As always, to assess this, we must scale.
The numbers here aren’t astronomical. Exhibit 1 shows cumulative monthly year-to-date customs duties for the past five years. May’s year-to-date take is $44.9 billion, versus $24.8 billion in October 2017 – May 2018. But US GDP clocked in at $20.5 trillion in 2018. Trillion, with a T. Even if you pencil in another $20 billion of tariff revenues over the rest of this fiscal year, which is straight-line back-of-the-envelope math with no scientific basis other than being a rough average of the past four months, the tariff take amounts to 0.3% of GDP.
Exhibit 1: A Brief History of Tariff Revenues
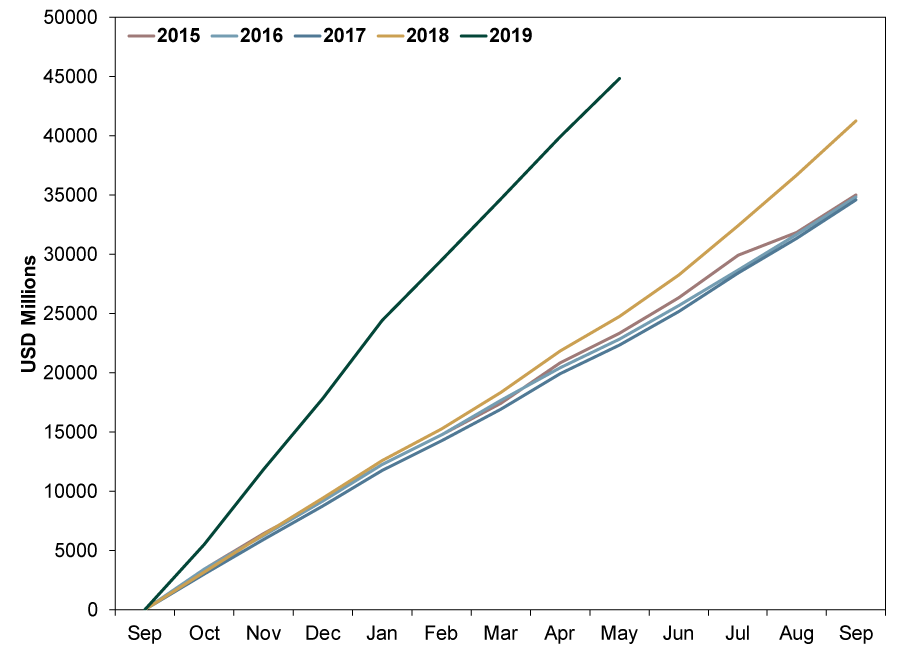
Source: FactSet, as of 6/13/2019. Based on monthly customs duties, October 2014 – May 2019.
Then again, GDP perhaps isn’t the best way to scale tariffs, as it has some wonky inputs. Not least of all, it doesn’t include the very thing tariffs are attached to: imports. So, we think it is most helpful to compare tariff revenues to imports. As Exhibit 2 shows, monthly tariff payments have inched up from 1.5% of goods imports in December 2017, before all these new tariffs started taking effect, to 2.5% in April, the latest month for which import data are available. Note, too, that imports haven’t plunged during this span. (Exhibit 3)
Exhibit 2: Tariff Revenues as a Percentage of Goods Imports
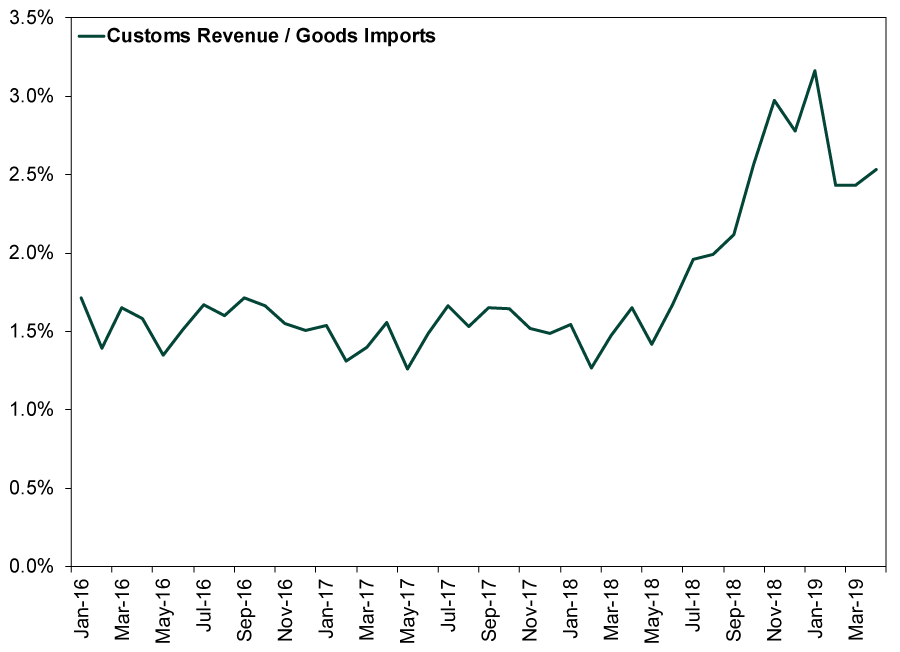
Source: FactSet, as of 6/13/2019. Monthly customs revenue and goods imports, January 2016 – April 2019.
Exhibit 3: Monthly Goods Imports
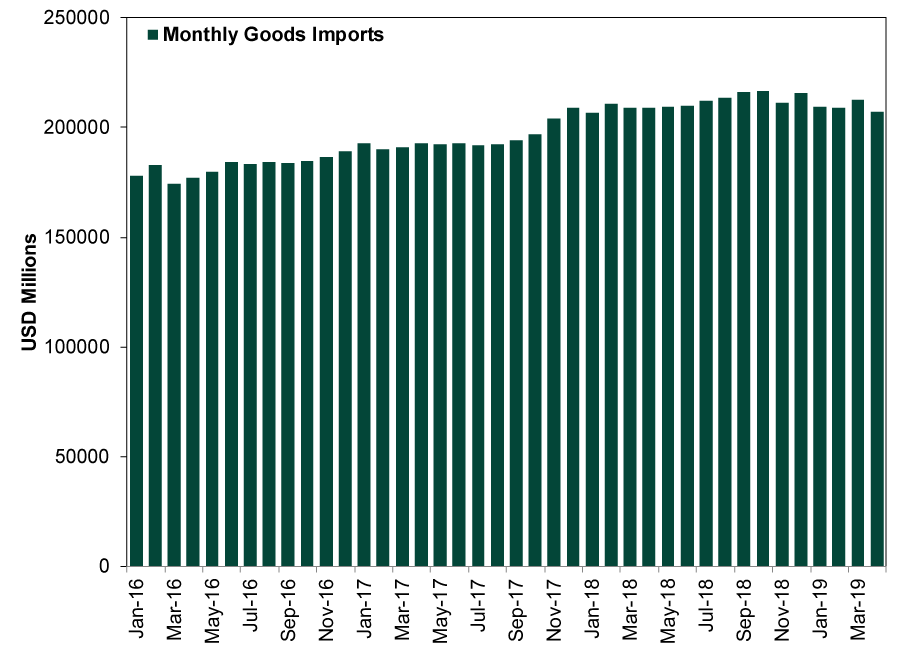
Source: FactSet, as of 6/13/2019. Monthly goods imports, January 2016 – April 2019.
From this, we draw two conclusions. One, tariffs aren’t breaking US consumers’ and businesses’ backs. They aren’t pleasant or positive, but they aren’t anywhere near large enough of a minus to wreak economic havoc. Two, tariffs aren’t discouraging trade much. They are perhaps redirecting it to an extent, but demand is also strong enough that people are willing to stomach paying a bit more in taxes for the privilege of sourcing goods, raw materials and components overseas. That suggests to us the widely feared threat of a trade-war driven recession is unlikely to materialize. As that dawns on investors, we would expect relief to buoy sentiment—and stocks.
If you would like to contact the editors responsible for this article, please message MarketMinder directly.
*The content contained in this article represents only the opinions and viewpoints of the Fisher Investments editorial staff.
Get a weekly roundup of our market insights
Sign up for our weekly e-mail newsletter.

You Imagine Your Future. We Help You Get There.
Are you ready to start your journey to a better financial future?

Where Might the Market Go Next?
Confidently tackle the market’s ups and downs with independent research and analysis that tells you where we think stocks are headed—and why.
Related Resources
-
In The News Expert says investors are ignoring a massive global rally2026-06-22
-
Expert Commentary 3 Things You Need to Know This Week | Global PMIs, US PCE Inflation, Annuities
 2026-06-22
 -
Politics Revolving Door Turns, Uncertainty Starts Falling2026-06-22
-
Weekly Wrap-Up Fisher Investments Reviews: Last Week in Markets—June 15 - June 192026-06-22


Learn More
Learn why 200,000 clients trust us to manage their money and how Fisher Investments and its affiliates may be able to help you achieve your financial goals.
As of 3/31/2026
New to Fisher? Call Us.
Contact Us Today