Personal Wealth Management / Economics
Some Perspective on the Dip
US GDP growth took a breather according to Wednesday’s advance report. But under the hood, signs of strength remain intact.

For the bulk of the past two years, we’ve often reminded readers headline GDP growth doesn’t fully reflect economic health—and can, in fact, tell a rather skewed story. US Q4 2012 GDP, released early Wednesday morning, puts an exclamation point on that sentence in our view.
The report showed headline real GDP shrank -0.1% in the quarter—missing consensus estimates of +1.0% growth.Now, to be sure, the report is preliminary and is subject to revision—occasionally large revisions—as the data set used is incomplete.
But that’s beside the point. To see this report for what it truly is, one must look beyond the flat-to-very-small-dip in headline growthand see the components. Here there is both good news and bad news.
Exhibit 1: Headline US Real GDP
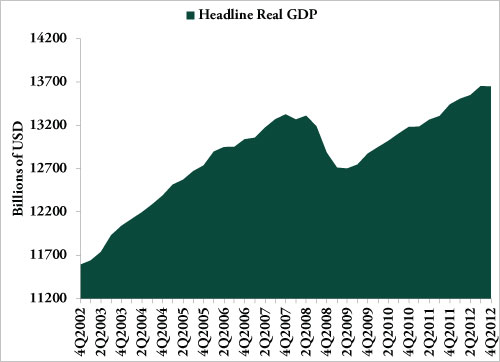
Source: US Bureau of Economic Analysis, Real GDP Q4 2002 – Q4 2012.
Leading with the bad news: the detracting factors in Q4’s report. Total trade had a poor showing in Q4, with imports falling -3.2% (SAAR) and exports falling at a faster -5.7% rate. The net effect was a detraction of -0.3 percentage point from headline growth. Yet there’s an important caveat to this—trade data are among the most incomplete when preliminary GDP is released. The Census Bureau, the official reporter of trade statistics, is still on November as of this writing and the December release isn’t even due until February 8. As such, with a full month yet to be formally tallied, there’s room for rather material upward or downward revision.
Exhibit 2: Detractor #1—Trade
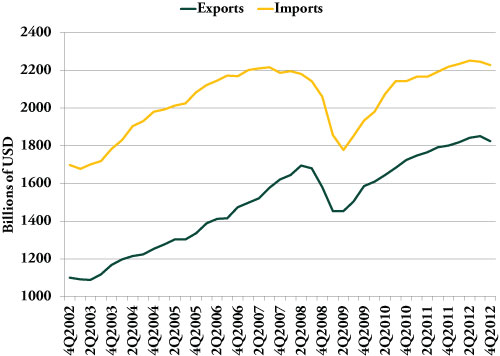
Source: US Bureau of Economic Analysis, Real Exports and Imports, Q4 2002 – Q4 2012.
In addition to trade, change in private businesses inventories detracted -1.3 percentage point from headline GDP. This factor, however, is subject to interpretation. For example, did inventories fall by $40 billion from the prior quarter because retailers didn’t order enough goods to keep pace with consumer spending? Did they slash in expectation of slower spending ahead? Was it some combination? Given the fact the private sector seemed healthy in the report (stay tuned), does this imply they’ll restock in Q1, providing a tailwind to growth? Ultimately, this figure alone doesn’t tell you very much.
Exhibit 3: Detractor #2—Inventory Change
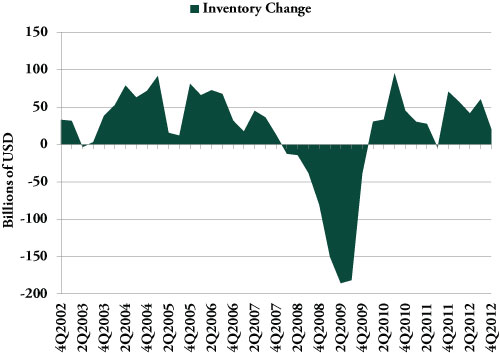
Source: US Bureau of Economic Analysis, Real Inventory Change, Q4 2002 – Q4 2012.
The big detractor—above and beyond all this—was government spending going off a cliff, the fungible cliff’s movement notwithstanding. Paced by a -22% decline in defense spending, federal government expenditures fell at a -15% rate in the quarter. This sharp drop subtracted another -1.3 percentage point from headline GDP growth. Yet falling government expenditure is nothing truly new, we’ve seen that in 10 of the 14 quarters since the 2007-2009 recession ended.
Exhibit 4: Detractor #3—Total Government Spending and Investment
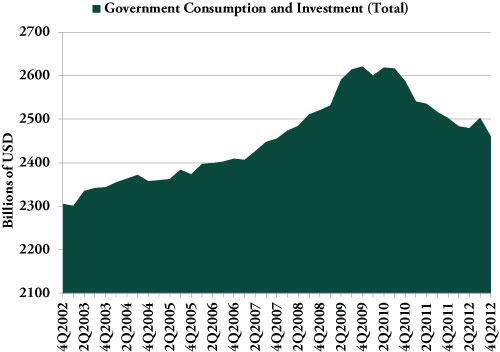
Source: US Bureau of Economic Analysis, Real Government Spending and Investment, Q4 2002 – Q4 2012.
That constitutes the principal bad news in the report. As to the good, what the report showed is continued private sector growth.
Consumer spending rose at a +2.2% rate in the quarter, adding +1.5 percentage point to headline growth and offsetting the government spending declines. Business investment (Nonresidential Private Fixed Investment) grew at a +8.4% rate, paced by equipment and software spending (+12.4% SAAR). Business investment, often maligned by the punditry, added +1.2 percentage point to headline growth. Residential real estate posted a 15.3% growth rate in the quarter, contributing 0.4 percentage point to headline GDP growth (which—though growing—also illustrates how small a contributor real estate actually is).
Exhibit 5: Positive Contributor #1—Real Personal Consumption

Source: US Bureau of Economic Analysis, Real Personal Consumption Expenditures, Q4 2002 – Q4 2012.
Exhibit 6: Positive Contributor #2—Real Business Investment
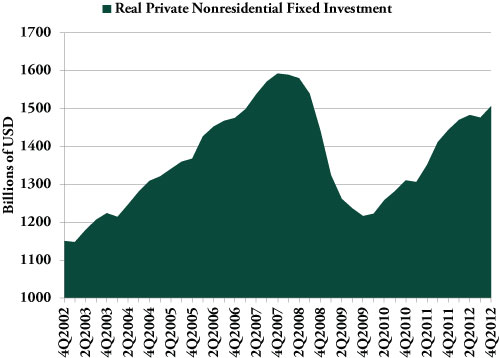
Source: US Bureau of Economic Analysis, Real Nonresidential Private Fixed Investment, Q4 2002 – Q4 2012.
Exhibit 7: Positive Contributor #3—Real Residential Real Estate Investment
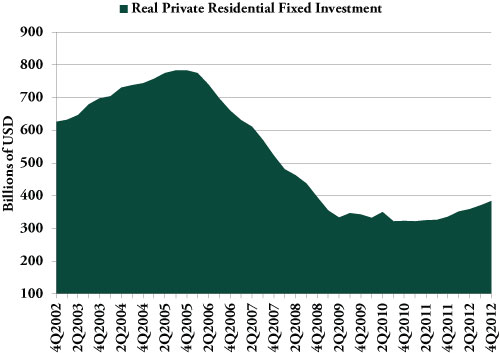
Source: US Bureau of Economic Analysis, Real Residential Real Estate Investment, Q4 2002 – Q4 2012.
Growth rates—headline or other—can and do vacillate. But the bigger, broader picture shows components that dominate US economic activity grew in the quarter. If, after revisions, the huge majority of the US economy continues to grow, a temporary vacillation driven by government spending doesn’t seem to be much to worry about.
Exhibit 8: Summary of Major Factors Influencing US Q4 GDP
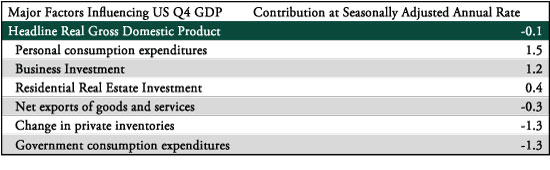
Source: US Bureau of Economic Analysis. Contributions to headline growth rate.
If you would like to contact the editors responsible for this article, please message MarketMinder directly.
*The content contained in this article represents only the opinions and viewpoints of the Fisher Investments editorial staff.
Get a weekly roundup of our market insights
Sign up for our weekly e-mail newsletter.

You Imagine Your Future. We Help You Get There.
Are you ready to start your journey to a better financial future?

Where Might the Market Go Next?
Confidently tackle the market’s ups and downs with independent research and analysis that tells you where we think stocks are headed—and why.
Related Resources
-
Expert Commentary This Week in Review | Q2 Market Recap, June US Jobs, Trade Deal Update
 2026-07-03
 -
Market Analysis Declaring Fed Independence Fears False2026-07-01
-
Market Analysis Why El Niño Doesn’t Necessitate Portfolio Shifts2026-07-01
-
Market Analysis Reader Mailbag: June 20262026-06-30


Learn More
Learn why 200,000 clients trust us to manage their money and how Fisher Investments and its affiliates may be able to help you achieve your financial goals.
As of 3/31/2026
New to Fisher? Call Us.
Contact Us Today