Personal Wealth Management / Financial Planning
The Dow, Your Portfolio and Bad Comparisons
The Dow is everywhere, but it isn’t a good performance comparison for most investors.

How do you measure portfolio performance? Some common answers are “I compare portfolio values at some starting point to some later point” or “I see what [insert online brokerage here] reports!” Both have some merit, but they are incomplete. Evaluating your results requires comparing them to the market. For many US investors, this might seem easy: Just use the Dow! It is everywhere! But while the Dow is popular, it isn’t a great comparison point. The index you use as a measuring stick should closely resemble your portfolio’s makeup, and for most folks, using the Dow is like comparing apples to orangutans.
Comparing your portfolio to an index to gauge returns, risk and allocation is what we call benchmarking. Optimal benchmarking requires selecting a broad index resembling your portfolio’s geographic and sector composition. Don’t just find any old index that matches what you happen to own. Rather, pick a broad market index and use it as a blueprint for portfolio construction. It should be the sole performance comparison point, because it is what your portfolio aims to echo. Using other references can lead you astray whether you compare your performance to an unrelated index or your neighbor Jim, who hit it big with bitcoin this year. If you refrained from cryptocurrency speculation, Jim’s returns are irrelevant to you. Using the wrong measuring stick can lure you away from a sound long-term strategy, potentially with devastating consequences.
While that is an extreme example, here is a more common one: If you invest globally, you shouldn’t compare your portfolio to a US-only index like the Dow. US stocks account for about 60% of the developed world.[I] So, US-only indexes ignore a huge portion of what contributes to a global portfolio. Stacking a global portfolio’s returns against a US-only index isn’t fair—nearly half your portfolio is outside the comparison.
If you are global but reference the Dow, your portfolio’s better diversification subjects it to drivers the Dow ignores. Each country’s economy and politics influence its stocks. For example, Dutch and French stocks rose this year as investors gained clarity over their widely feared elections, which settled fears of euroskeptic populism. Similarly, while the US yield curve spread—the gap between short and long rates—shrank this year, yield spreads throughout the eurozone widened, boosting loan profitability and some European financials. These factors influence a global portfolio’s performance, but the Dow ignores them.
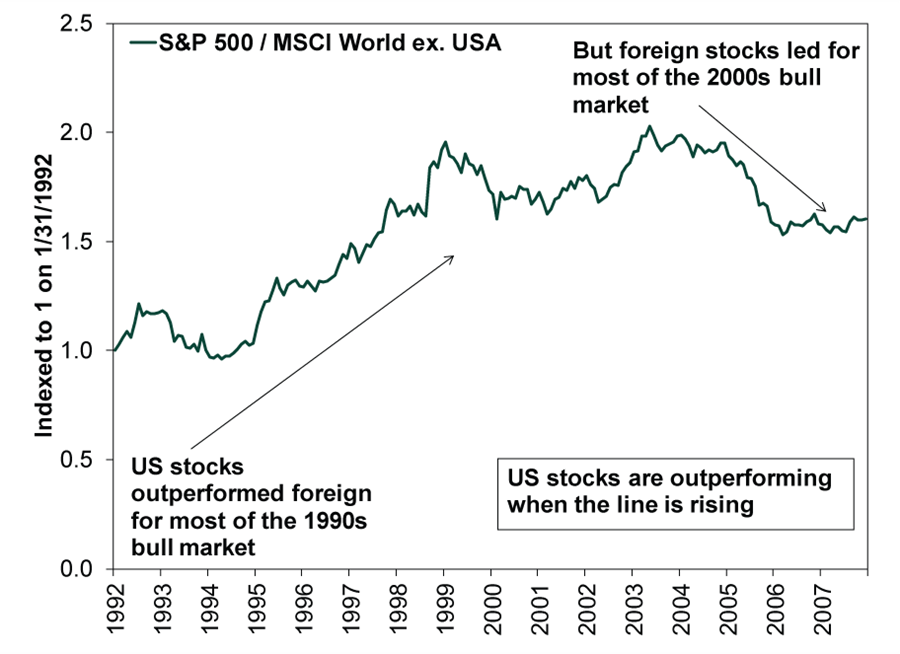
Further, US and foreign stocks often trade leadership. A US-only portfolio would have outperformed a global portfolio during the 1990s bull market, but non-US led during the 2002 – 2007 bull. Non-US led this bull market’s initial burst before handing off to US in 2010—leadership that persisted until this year. We expect US stocks to trail for the foreseeable future, but using the US-only Dow as a benchmark could cause global investors to overreact if the US leads in a short countertrend.
Exhibit 1: US and Foreign Outperformance Rotates
Source: FactSet as of 12/12/2017. S&P 500 Total Return Index and MSCI World ex. USA Index with net dividends, monthly, 1/31/1992 – 12/31/2007.
Even for a US-only portfolio, the Dow is probably a poor gauge. It contains just 30 of the US’s 3,503 publicly traded firms. If the Dow outperforms a diverse US portfolio, it is usually because a couple of its constituents are up big. That doesn’t make the Dow superior. It simply speaks to its lack of diversification. Underscoring this, the Dow heavily overweights the Tech stocks yet omits Real Estate and Utilities. Though these sectors represent just a small portion of the overall market, your benchmark should still include them in order to better reflect the market.
Exhibit 2: Sector Weights, Dow vs. S&P 500
Source: FactSet, Dow Jones Industrial Average and S&P 500 Indices, as of 11/30/2017. Dow Jones weights calculated using adjusted market values as of 11/30/2017.
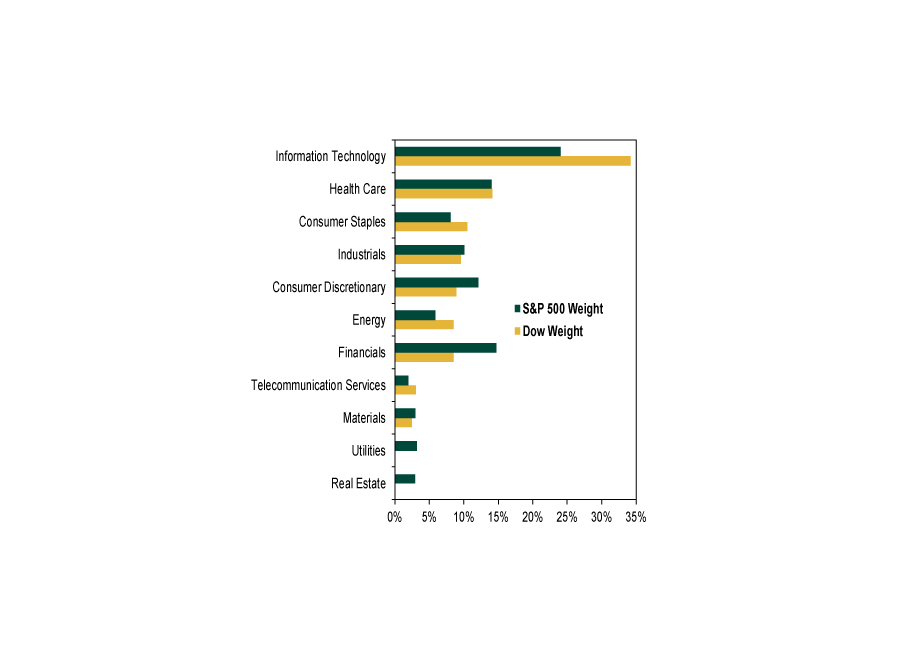
While Tech is 24% of the S&P 500—a broad US index—it is 34% of the Dow by market cap.[II] Because of this, you might think the Dow should beat the S&P 500 when Tech is leading and trail when Tech is down. However, this isn’t always the case. During the June 8 – July 3 Tech selloff, the S&P 500 Tech sector fell -2.63%, and the S&P 500 was flat, yet the Dow rose 1.05%.[III] How so? While the Dow is way overweight Tech by market cap, other sectors—particularly Industrials—influence the Dow’s performance more since it is price-weighted, not cap-weighted. A company’s share price, not its size, determine its clout in the index. If Mom-and-Pop’s Popsicle Shop issues one share of stock worth $5,000, it will influence a price-weighted index much more than a $500 billion corporation trading at $80 per share. In the Dow, Boeing and 3M—with respective market caps of $145 billion and $165 billion—have more influence than Apple and Microsoft, worth $882 billion and $649 billion, respectively.[IV] Plus, your portfolio is market cap-weighted, not price-weighted. When you own a stock, you care about its value as a percentage of your account. So comparing your returns to a price-weighted index is inaccurate.
Comparing your performance to an unrelated index, Dow or otherwise, can lead to myopic moves that can hamper your long-term returns. For example, your global portfolio might have returned around 7% in 2016 while the S&P 500 returned 13.5%.[V] Had you chased the heat, you would be less diversified and miss non-US’s superior performance this year. Dow envy could lead to even weirder decisions like swapping Tech for a higher Industrials weighting—a suboptimal choice this late in a bull market, when Industrials usually lag and Tech usually leads (as happened this year).
Whatever the potential error, chasing an irrelevant index’s returns means basing decisions on past performance, which is never predictive. Stay focused on what is relevant, keep a longer perspective, and don’t let shiny objects distract you from a sound long-term strategy.
[I] Source: FactSet, as of 11/30/2017. US stocks as a percentage of MSCI World Index market cap.
[II] Source: FactSet, as of 11/30/2017. Tech sector as a percentage of the Dow Jones Industrial Average and S&P 500 Index market cap on 11/30/2017.
[III] Source: FactSet, as of 12/12/2017. S&P 500 Information Technology Total Return Index, S&P 500 Total Return Index and Dow Jones Industrial Average, 6/8/2017 – 7/3/2017.
[IV] Source: FactSet, as of 11/30/2017. Market capitalization on 11/30/2017.
[V] Source: FactSet, as of 12/18/2017. S&P 500 Total Return Index, 12/31/2015 – 12/31/2016.
If you would like to contact the editors responsible for this article, please message MarketMinder directly.
*The content contained in this article represents only the opinions and viewpoints of the Fisher Investments editorial staff.
Get a weekly roundup of our market insights
Sign up for our weekly e-mail newsletter.

You Imagine Your Future. We Help You Get There.
Are you ready to start your journey to a better financial future?

Where Might the Market Go Next?
Confidently tackle the market’s ups and downs with independent research and analysis that tells you where we think stocks are headed—and why.
Related Resources
-
Expert Commentary This Week in Review | Q1 Recap, Earnings Guidance, Elections
 2026-04-03
 -
Market Analysis A Forward-Looking Lesson One Year After Liberation Day2026-04-02
-
Market Volatility Some Timeless Counsel After March’s Volatility2026-04-01
-
Market Analysis Countertrends and Corrections: Banks in 2026’s Early Selloff2026-04-01


Learn More
Learn why 200,000 clients trust us to manage their money and how Fisher Investments and its affiliates may be able to help you achieve your financial goals.
As of 3/31/2026
New to Fisher? Call Us.
Contact Us Today