Personal Wealth Management / Market Analysis
The Path to Wealth Isn’t Through Homeownership
Home is where the heart is, but better long-term investment returns are in the stock market.

Last week, the Fed published its triennial Survey of Consumer Finances, which triggered predictable hubbub over inequality[i]-largely too sociological and inconsequential for markets. But of all the media angles emerging from this, there is a directly investment-related one we take issue with: Housing as "The one surefire way to grow your wealth in the U.S." Stocks and other liquid securities not only offer a viable path to wealth, but history suggests it's a faster road.
The study claims homeowners are gaining wealth far faster than renters, and media seized this to claim it shows the power and virtue of owning a home. Some may see this as supporting the view that real estate is a terrific investment. But there are some issues with that-principally, the fact stocks far outpace housing historically. And stocks are available for renters or homeowners to take advantage of.
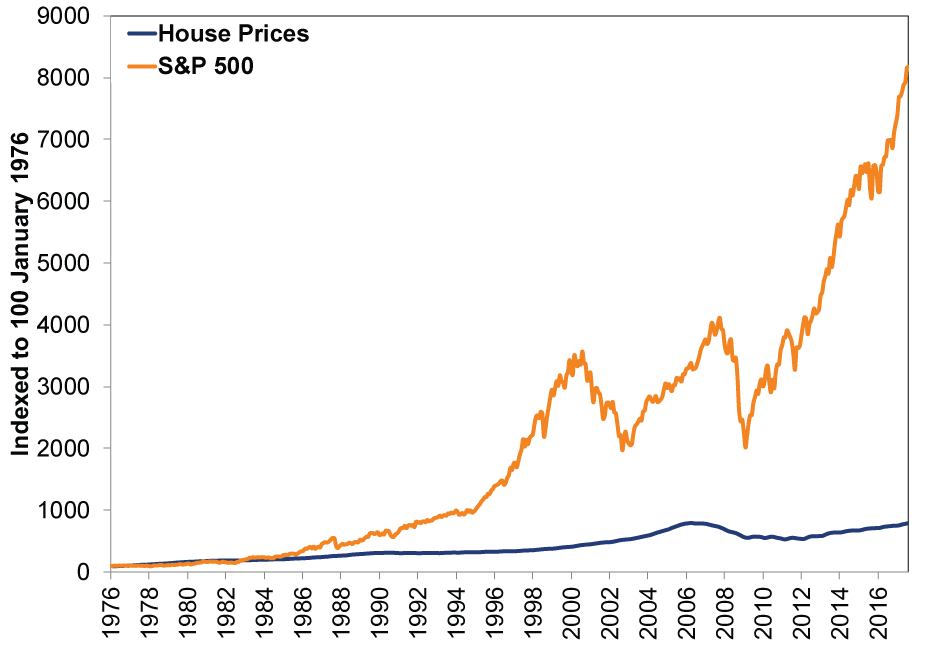
Through thick and thin, the S&P 500's annualized return since 1926-when good data begin-is 10.8%.[ii] Home prices nationally have returned 4.6% since 1976.[iii] Now, of course, these time periods differ. But even if we compare the same 40-ish years, stocks far outpace housing. (Exhibit 1)
Exhibit 1: Stock Returns Leave Home Appreciation in the Dust
Source: Global Financial Data and FactSet, as of 10/2/2017. Corelogic national single-family combined house price index and S&P 500 total return, January 1976 - August 2017.
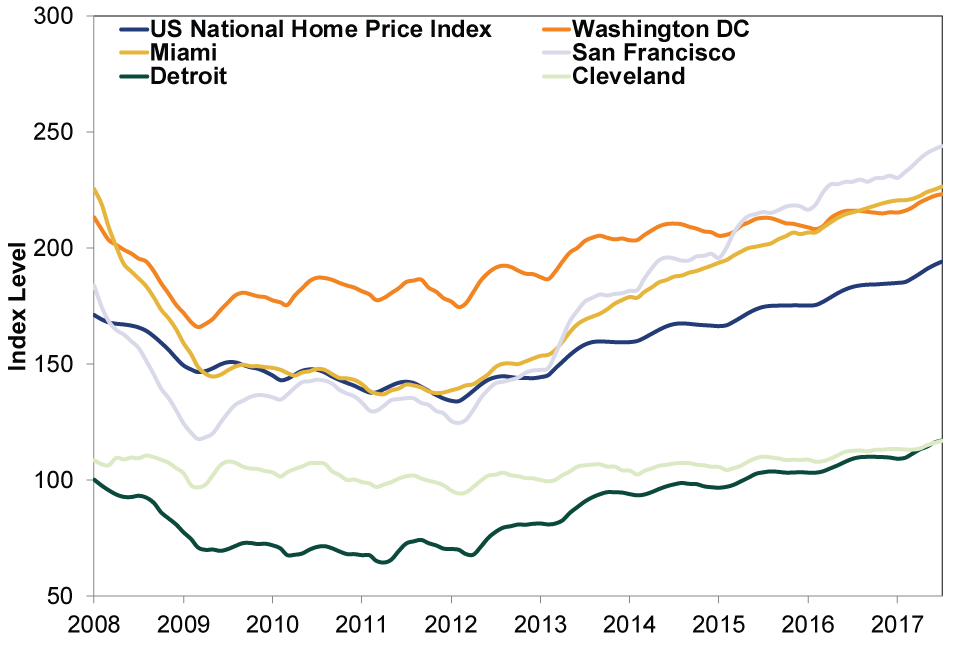
And whereas returns near the average are achievable for the typical stock investor, it would be exceedingly difficult for an individual homeowner to realize average house price gains nationally, or even regionally. There isn't an investable index. There is large divergence from city to city and state to state. Property in San Francisco has not historically performed like property in Cleveland. The Case-Shiller gauge of San Francisco home prices is up 87% since the end of 2008. Cleveland? 11%.[iv] Simply put, there isn't a national housing market.
Exhibit 2: Home Prices Vary by Region, Select Cities
Source: S&P Global, as of 10/2/2017. S&P CoreLogic Case-Shiller US National, Washington DC, Miami, San Francisco, Detroit and Cleveland Home Price Index, not seasonally adjusted, June 2007 - July 2017.
Housing returns diverge within cities, too. Getting city-average returns requires proper diversification-owning a portfolio of homes in different neighborhoods. Property management-much less real-estate mogul-hood-isn't easy (or inexpensive). Stock investors can diversify and are more liquid. Many homebuyers must take out a mortgage to afford a home-increasing the risk you lose more than your initial investment. Even in the rip-roaring Bay Area, returns like the last eight years aren't guaranteed for the next. Of course, stock returns aren't guaranteed either, but corporations retain earnings to reinvest. They adapt to technological, societal and customer demand shifts. They innovate. That's why over time returns compound. Residential property? You can't upgrade or modernize it easily without investing a boodle of bucks.
As Ken Fisher writes in The Ten Roads to Riches,[v] price appreciation in a home you own isn't your actual return, as it doesn't include all the upkeep costs and property taxes. For example, 1995 to 2005 was one of the best times to own a house in the Bay Area. Take San Mateo-halfway between San Francisco and Silicon Valley, where Ken grew up. The median home price was about $305,000 in 1995. If you bought exactly that with 20% down (or $61,000) and 1% closing costs, you'd be paying about $1,700 a month using the going 7.5% rate on a 30-year fixed mortgage. In 10 years, if you sold at the median home price-$763,000 in 2005-timing it just before the housing downturn, you'd have made about $579,000 after settling the remaining $184,000 mortgage balance. A return of 849% over your $61,000 down payment, or 25.2% annualized. Seems yuuuuge! But these high returns are mostly due to huge leverage and holding on for a long time. Plus, they ignore costs incurred along the way. In those 10 years of homeownership, you also paid over $60,000 in principal and more than $247,000 in interest. After that, annualized gains are whittled down to 10.6%. Add in thousands more for maintenance, utilities, property taxes and other fees, and returns fall even further. So even in a great area at a great time, housing returns aren't all they're cracked up to be.
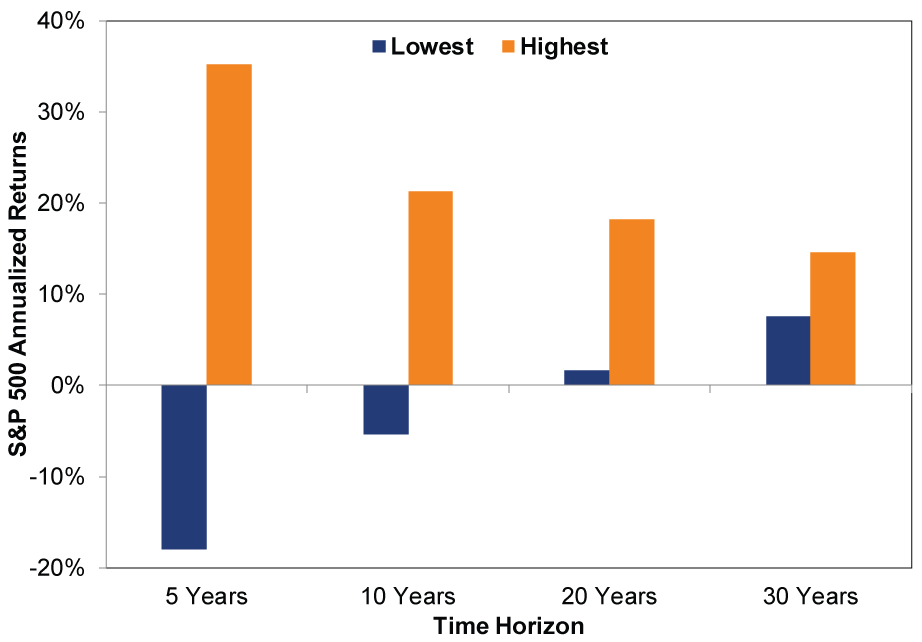
A key aspect to why housing seems like it provides big returns is the long time horizon it almost forces you to maintain. Houses aren't very liquid and most folks don't buy with the thought they'll sell in a year. This forces a long-term perspective. Applying that same discipline to stocks isn't sexy or anything to brag about, but a sufficiently diverse stock portfolio likely outclasses residential real estate over the long run. Of course, stocks and real estate will both show periods where returns diverge from long-term averages-particularly true the shorter the time frame you assess. But with time, returns tend to vary less. (Exhibit 3)
Exhibit 3: Stock Returns Diverge Less With Time
Source: Global Financial Data and FactSet, as of 10/2/2017. Highest and lowest 5-, 10-, 20- and 30-year rolling S&P 500 total returns, annualized, December 1925 - September 2017.
There are lots of benefits to homeownership, to be sure. And building equity is one. But presuming homeownership is the one path to wealth overrates housing's viability as an investment and severely underrates long-term investing in more liquid assets.
[i] Despite it showing all groups by income level, race and education doing better.
[ii] Source: Global Financial Data and FactSet, as of 10/2/2017. S&P 500 total return, 12/31/1925 - 9/30/2017.
[iii] Source: CoreLogic, as of July 2017. National single-family combined house price index, January 1976 - July 2017.
[iv] Source: S&P Global, as of 10/2/2017. S&P CoreLogic Case-Shiller San Francisco and Cleveland Home Price Indexes, December 2008 - July 2017. And this trails stocks' 231% return over the same span.
[v]Second Edition now available!
If you would like to contact the editors responsible for this article, please message MarketMinder directly.
*The content contained in this article represents only the opinions and viewpoints of the Fisher Investments editorial staff.
Get a weekly roundup of our market insights
Sign up for our weekly e-mail newsletter.

You Imagine Your Future. We Help You Get There.
Are you ready to start your journey to a better financial future?

Where Might the Market Go Next?
Confidently tackle the market’s ups and downs with independent research and analysis that tells you where we think stocks are headed—and why.
Related Resources
-
Expert Commentary Ken Fisher on Measuring Inflation, Currency Reset, Commodities, and more2026-03-25
-
Market Analysis The Golden Paradox2026-03-24
-
Weekly Wrap-Up Fisher Investments Reviews: Last Week in Markets—March 16 - March 202026-03-23
-
Expert Commentary PMIs, Denmark Snap Election, Tax Season | 3 Things You Need to Know This Week2026-03-23


Learn More
Learn why 195,000 clients trust us to manage their money and how Fisher Investments and its affiliates may be able to help you achieve your financial goals.
As of 12/31/2025
New to Fisher? Call Us.
Contact Us Today