Personal Wealth Management / Economics
The Real Limits of Real-Time Data
What investors should consider when reviewing high-frequency data.

After a rocky September for markets, some worry more trouble looms. Besides chatter about US presidential election-related volatility, ominous economic storm clouds are allegedly gathering. In some experts’ opinion, the latest spate of high-frequency data—timely but narrow economic indicators—are “flashing warning signs.” While they can be useful at times, in our view, high-frequency data have many limitations investors must consider before reaching large conclusions.
First up: Initial jobless claims for the week ending September 19 ticked up to 870,000 from 866,000 a week earlier.[i] Some blamed ongoing layoffs for the lack of improvement—perhaps signaling weak demand. Beyond this, the number of travelers passing through Transportation Security Administration (TSA) checkpoints is still way down from last year.[ii] Foot traffic at restaurants, gyms and other “close contact” businesses has stalled and estimates of seated diners at restaurants dipped for a second straight week.[iii] Improvement in small businesses’ new job openings and employee hours worked has slowed, too.[iv] Not all high-frequency data are flagging (e.g., hours worked at manufacturing firms continue to improve), but many economists worry the latest data showing either a stall or slower growth suggest the recovery is losing steam following a steep summertime jump—a sign of trouble on the horizon.[v]
In our view, these dour observations overstate what high-frequency data series show us. Yes, they reflect real-time conditions and can occasionally reveal turning points ahead of more detailed measures—as was the case earlier in the year. But like traditional economic indicators, high-frequency gauges have their shortcomings. If monthly and quarterly readings are subject to short-term wobbles, weekly and daily numbers are even noisier. Many high-frequency data series also aren’t seasonally adjusted, so they don’t account for usual skew related to the time of the year. You could look at year-over-year data in these series—which wouldn’t be subject to seasonal effects—but then the “timely” series becomes much more backward-looking. Events from a year ago could affect the calculation’s base.
Since high-frequency metrics usually track narrow slices of specific economic segments, they aren’t necessarily representative of what is going on more broadly. They also tend to treat movement as a proxy for economic activity—but important details are missing. For example, many equate increased foot traffic in retail areas with higher sales. But foot traffic doesn’t tell you the dollar amount spent—or if people are even buying things. What if they are picking up online purchases, merely browsing or, gasp, returning items?
While most official data go back years—even decades—many high-frequency datasets we see today lack that history. Some small business-focused datasets can inform us about today’s economic damage, but how does it compare to past recessions? That historical perspective can provide important context for 2020’s numbers. Relatedly, some high-frequency data series may be reflecting behavior altered by COVID. Due to seating capacity restrictions, more restaurants may have opted to allow for reservations via vehicles like OpenTable or Yelp. Some customers may think reservations are necessary, too, as reduced seating capacity could have them fretting long waits. These factors could have contributed to a spike in reservations when restaurants first started opening—and some recent tapering may reflect both consumer and business adjustments based on recent experience.
Looking under the hood can reveal how noisy a high-frequency dataset can be. Take hospitality data firm STR’s weekly US hotel occupancy rate. The rate plunged in March as states implemented shelter-in-place orders, rebounding sharply in May and June as restrictions started easing. Since July, though, the rate has flattened—stoking worries. (Exhibit 1)
Exhibit 1: US Hotel Occupancy Rate
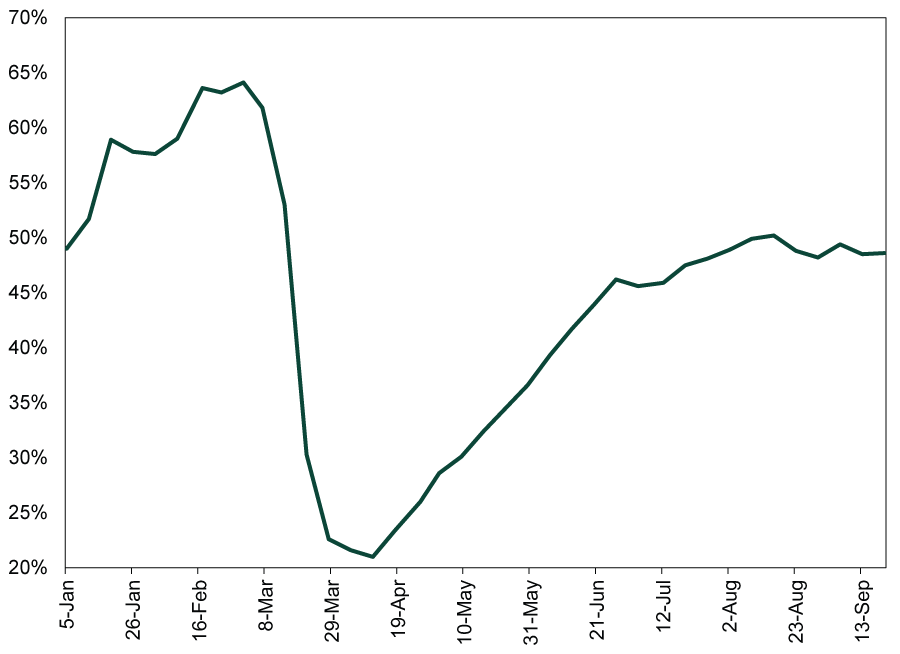
Source: STR, as of 9/25/2020. H/T Fisher Investments Research Analysts.
However, this high-level look doesn’t capture the divergence in individual states’ experiences. For instance, natural disasters (wildfires and hurricanes) may have affected occupancies in many parts of the country recently. The impact on these data is unclear, but it wouldn’t mean much of anything for where occupancy goes in the future.[vi] Different COVID travel rules may be impacting the headline number, too. For example, Hawaii currently requires a 14-day self-quarantine for all travelers while Florida has no travel restrictions.[vii] Moreover, a lack of seasonal adjustment makes this a weekly snapshot without context. Travel plans tend to depend on work and/or school schedules. Without accounting for expected seasonal fluctuations, determining the extent of COVID restrictions’ effect is even more difficult this year.
We also suggest refraining from drawing major conclusions from new, COVID-focused data series. The Census Bureau, in collaboration with other federal agencies, recently released the “Household Pulse Survey”—an attempt to provide a real-time snapshot of how Americans think COVID-19 will impact their economic situation. Besides the inherent shortcomings of surveys—they reflect how people are feeling at one moment in time, which isn’t indicative of future behavior—the Household Pulse Survey just started collecting data for its latest survey iteration on August 19. The Census Bureau also acknowledged they are still refining their data-collection process. This doesn’t mean you must ignore the survey’s findings, but experimental data series deserve even more scrutiny.
In our view, high-frequency data can be useful. But they aren’t uniquely forward-looking, either—just rough real-time snapshots. Given their constant presence in headlines today, they aren’t likely to reveal anything surprising to stocks. Focusing too much on them could prompt mistakes—especially during volatile times.
[i] Source: Department of Labor, as of 9/28/2020.
[ii] “Airports compete for worried flyers with on-site COVID-19 testing, TSA appointments, cleaning robots,” Harriet Baskas, USA Today, September 28, 2020.
[iii] “Visits to U.S. stores, restaurants stall as concern over economic recovery grows,” Howard Schneider, Reuters, September 24, 2020.
[iv] Ibid.
[v] Ibid.
[vi] “U.S. Hotel Results for Week Ending 19 September,” Staff, STR, September 24, 2020.
[vii] Assuming no change to plans, Hawaii’s mandate will lift in mid-October for visitors who test negative for COVID within 72 hours of arrival in the islands.
If you would like to contact the editors responsible for this article, please message MarketMinder directly.
*The content contained in this article represents only the opinions and viewpoints of the Fisher Investments editorial staff.
Get a weekly roundup of our market insights
Sign up for our weekly e-mail newsletter.

You Imagine Your Future. We Help You Get There.
Are you ready to start your journey to a better financial future?

Where Might the Market Go Next?
Confidently tackle the market’s ups and downs with independent research and analysis that tells you where we think stocks are headed—and why.
Related Resources
-
Market Analysis Reviewing Q1 Earnings and What Q2 Expectations Say2026-06-18
-
Market Analysis Kevin Warsh and the Magical Delete Button2026-06-17
-
Market Analysis The Politics and Practicalities of the Social Security Trust Fund2026-06-16
-
Market Analysis Gold Fails the Safe Haven Test Again2026-06-16


Learn More
Learn why 200,000 clients trust us to manage their money and how Fisher Investments and its affiliates may be able to help you achieve your financial goals.
As of 3/31/2026
New to Fisher? Call Us.
Contact Us Today